Skip to content

Windows: experimental Xbox Developer Mode (UWP) target - #6140

Open
shai-almog wants to merge 4 commits into
masterfrom
xbox-dev-mode-target
Open

shai-almog wants to merge 4 commits into
masterfrom
xbox-dev-mode-target

Conversation

@shai-almog

Copy link
Copy Markdown
Collaborator

Experimental Xbox Developer Mode target for the native Windows port, as a first step toward gaming consoles.

windows.xbox=true builds the port as a UWP app:

  • cn1_windows_corewindow.cpp: CoreApplication/CoreWindow host, D3D11 + Direct2D flip-model swap chain, pointer and gamepad input, view-thread safe area and title.
  • Compiled against the app partition, linked to WindowsApp.lib only with /APPCONTAINER: the link proves every import exists in the container.
  • Desktop-only natives are compiled out and stubbed by scripts/gen-windows-uwp-stubs.py (--check in CI).
  • Gamepad D-pad/stick/A/B map to game actions and back; the console's visible bounds are the display safe area.
  • Builder: UWP manifest (Windows.Universal, no full trust), MSIX via makemsix, signed; a self-signed dev certificate is created when none is supplied.

Verification:

  • windows-cross-compile.yml cross-builds desktop and UWP exes on Linux, creates the dev cert with the builder's own code, then on a Windows runner packs, signs, installs and launches the app as a real UWP activation and waits for a marker it writes after its first frame.
  • Controller input and TV overscan need a console and are not verified; documented as experimental (Working-With-Windows + new Gaming consoles appendix).

🤖 Generated with Claude Code

shai-almog and others added 2 commits October 30, 2026 17:47
windows.xbox=true builds the native Windows port as a UWP app for an Xbox in
Developer Mode: a CoreWindow host rendering through a D3D11/D2D swap chain,
compiled against the app partition and linked to WindowsApp.lib alone, with
desktop-only natives stubbed by scripts/gen-windows-uwp-stubs.py. Gamepad keys
map to game actions and back; the console's visible bounds are the safe area.
The builder packs a signed MSIX, generating a dev certificate when none is
given. CI cross-builds it and installs + launches it on a Windows runner.

Co-Authored-By: Claude Opus 5.5 <noreply@anthropic.com>
Safe area and title are thread-bound to the view: insets are computed on the
view thread and cached, the title goes through CoreDispatcher.RunAsync. Stubs
whose 0 means success (desktopWindowCreate, printDocument) answer -1. A
supplied certificate needs windows.msix.publisher, or the package would never
install. CI signs the package with the builder's own development certificate.
Docs mark the target experimental and add a gaming consoles appendix.

Co-Authored-By: Claude Opus 5.5 <noreply@anthropic.com>
@github-actions

Copy link
Copy Markdown
Contributor

Cloudflare Preview

…ection

Co-Authored-By: Claude Opus 5.5 <noreply@anthropic.com>
@github-actions

github-actions Bot commented Oct 30, 2026 •

Copy link
Copy Markdown
Contributor

✅ Continuous Quality Report

Test & Coverage

Static Analysis

  • SpotBugs [Report archive]
    • ✅ ByteCodeTranslator: 0 findings (no issues)
    • ✅ android: 0 findings (no issues)
    • ✅ android-compat: 0 findings (no issues)
    • ✅ android-res-compiler: 0 findings (no issues)
    • ✅ backend: 0 findings (no issues)
    • ✅ backend-test: 0 findings (no issues)
    • ✅ build-engine: 0 findings (no issues)
    • ✅ build-hint-catalog: 0 findings (no issues)
    • ✅ build-hint-tools: 0 findings (no issues)
    • ✅ codenameone-gradle-plugin: 0 findings (no issues)
    • ✅ codenameone-maven-plugin: 0 findings (no issues)
    • ✅ compose-compat: 0 findings (no issues)
    • ✅ core-unittests: 0 findings (no issues)
    • ✅ desktop-compat-runtime: 0 findings (no issues)
    • ✅ fxml-compiler: 0 findings (no issues)
    • ✅ ios: 0 findings (no issues)
    • ✅ javac: 0 findings (no issues)
    • ✅ javafx-compat: 0 findings (no issues)
    • ✅ project-model: 0 findings (no issues)
    • ✅ swing-compat: 0 findings (no issues)
  • ✅ PMD: 0 findings (no issues) [Report archive]
  • ✅ Checkstyle: 0 findings (no issues) [Report archive]

Generated automatically by the PR CI workflow.

@shai-almog

shai-almog commented Oct 30, 2026 •

Copy link
Copy Markdown
Collaborator Author

Compared 231 screenshots: 231 matched.
✅ JavaScript-port screenshot tests passed.

@github-actions

github-actions Bot commented Oct 30, 2026 •

Copy link
Copy Markdown
Contributor

✅ ByteCodeTranslator Quality Report

Test & Coverage

  • ✅ Tests: 901 total, 0 failed, 55 skipped

Benchmark Results

  • Execution Time: 12167 ms

  • Hotspots (Top 20 sampled methods):

    • 11.56% com.codename1.tools.translator.IteratorEscape.mangle (206 samples)
    • 9.54% java.lang.System.identityHashCode (170 samples)
    • 7.01% java.util.ArrayList.indexOf (125 samples)
    • 4.77% java.lang.Object.hashCode (85 samples)
    • 3.42% java.lang.StringBuilder.append (61 samples)
    • 2.08% com.codename1.tools.translator.IteratorEscape.ctorOnlyStoresParamsIntoThis (37 samples)
    • 2.08% com.codename1.tools.translator.BytecodeMethod.equals (37 samples)
    • 1.96% java.util.HashMap.hash (35 samples)
    • 1.85% com.codename1.tools.translator.bytecodes.Invoke.resolveDirectTarget (33 samples)
    • 1.68% com.codename1.tools.translator.ByteCodeClass.markDependencies (30 samples)
    • 1.63% java.io.FileOutputStream.writeBytes (29 samples)
    • 1.63% com.codename1.tools.translator.ByteCodeClass.hasDeclaredMethod (29 samples)
    • 1.29% java.lang.String.equals (23 samples)
    • 1.29% com.codename1.tools.translator.bytecodes.Invoke.findMethodUp (23 samples)
    • 1.12% java.util.HashMap.putVal (20 samples)
    • 1.07% java.util.AbstractCollection.containsAll (19 samples)
    • 1.01% com.codename1.tools.translator.Parser.cullMethods (18 samples)
    • 1.01% com.codename1.tools.translator.BytecodeMethod.optimize (18 samples)
    • 0.95% com.codename1.tools.translator.JavascriptReachability.enqueueResolved (17 samples)
    • 0.95% com.codename1.tools.translator.BytecodeMethod.updateInlinableFieldDependencies (17 samples)
  • ⚠️ Coverage report not generated.

Static Analysis

  • ✅ SpotBugs: no findings (report was not generated by the build).
  • ⚠️ PMD report not generated.
  • ⚠️ Checkstyle report not generated.

Generated automatically by the PR CI workflow.

@github-actions

github-actions Bot commented Oct 30, 2026 •

Copy link
Copy Markdown
Contributor

Flutter vs Codename One

Same application, built both ways: Flutter's AOT compile of the gallery, and the identical Dart source transpiled to Java on Codename One. Lower is better for every metric, so a ratio above 1.00x means Codename One is ahead by that factor.

android

9 interleaved rounds; host load 0.38, 1.49, 1.15

Metric Codename One Flutter Ratio Winner
Installed size 78.3 MB 95.8 MB 1.22x Codename One
Executable code 4.7 MB 20.6 MB 4.35x Codename One
Download size (zipped) 78.3 MB 95.8 MB 1.22x Codename One
Cold start to first frame on screen 258 ms 1032 ms 3.99x Codename One
Memory at rest 46.2 MB 79.4 MB 1.73x Codename One

Start-up and memory at rest are judged round by round: the ratio is the median of the per-round ratios, each from two launches made back to back, and the times and sizes shown are each side's median, so the ratio need not equal their quotient. Codename One was ahead in 8 of 9 rounds on cold start to first frame on screen; 9 of 9 rounds on memory at rest.

Compute -- the VM workloads (vm/benchmarks), run inside each app; time is the best of the app's own repetitions, higher ratio means Codename One is faster.

Workload Codename One Flutter Ratio
intArithmetic 57 ms 119 ms 2.09x
longArithmetic 36 ms 34 ms 0.94x
mathTranscendental 164 ms 192 ms 1.17x
arraySequential 17 ms 20 ms 1.18x
arrayRandom 183 ms 204 ms 1.11x
objectAllocation 46 ms 23 ms 0.50x
valueEscape 7 ms 5 ms 0.71x
hashMapChurn 81 ms 169 ms 2.09x
stringBuilding 56 ms 78 ms 1.39x
recursion 43 ms 168 ms 3.91x
quicksortBench 103 ms 117 ms 1.14x
Geometric mean 1.27x

Gate: within tolerance against scripts/flutter-bench/baseline.

Android sizes are for the arm64-v8a slice a phone is delivered, on both sides; Flutter's release apk carries three ABIs and would otherwise count its engine about three times.
Android start-up and memory come from an x86_64 emulator with a software GPU. They compare the two runtimes on one machine; they are not phone timings, and a renderer that leans on the GPU is penalised more there.
This platform's adapter has not been exercised end to end before; treat the first published run as the thing under review.

ios

9 interleaved rounds; host load 39.17, 38.29, 28.35

Metric Codename One Flutter Ratio Winner
Installed size 108.5 MB 110.5 MB 1.02x Codename One
Executable code 17.4 MB 19.1 MB 1.09x Codename One
Download size (zipped) 80.0 MB 81.9 MB 1.02x Codename One
Cold start to first frame on screen -- -- -- not measured
Memory at rest -- -- -- not measured

Compute -- the VM workloads (vm/benchmarks), run inside each app; time is the best of the app's own repetitions, higher ratio means Codename One is faster.

Not measured: iOS compute is not measured: a device build needs signed hardware, and on the simulator Flutter runs its JIT debug engine rather than AOT code. The macOS row runs the same ParparVM and Dart AOT compilers on the same Apple silicon.

Gate: within tolerance against scripts/flutter-bench/baseline.

iOS start-up and memory are not measured here: Flutter cannot AOT-compile for the simulator, so a simulator run would time a JIT debug build against a release build. Sizes come from release device bundles; timings need signed hardware.
This platform's adapter has not been exercised end to end before; treat the first published run as the thing under review.

javascript

9 interleaved rounds; host load 2.35, 1.47, 0.67

Metric Codename One Flutter Ratio Winner
Installed size 104.4 MB 122.5 MB 1.17x Codename One
Executable code 13.3 MB 25.2 MB 1.89x Codename One
Download size (zipped) 76.4 MB 84.1 MB 1.10x Codename One
Cold start to first frame on screen -- -- -- not measured
Memory at rest -- -- -- not measured

Compute -- the VM workloads (vm/benchmarks), run inside each app; time is the best of the app's own repetitions, higher ratio means Codename One is faster.

Workload Codename One Flutter Ratio
intArithmetic 655 ms wrong result Flutter: wrong result
longArithmetic 5145 ms did not run Flutter: did not run
mathTranscendental 574 ms did not run Flutter: did not run
arraySequential 228 ms 83 ms 0.36x
arrayRandom 982 ms wrong result Flutter: wrong result
objectAllocation 37 ms 27 ms 0.73x
valueEscape 154 ms 7 ms 0.04x
hashMapChurn 1148 ms 241 ms 0.21x
stringBuilding 525 ms 108 ms 0.21x
recursion 507 ms 491 ms 0.97x
quicksortBench 426 ms wrong result Flutter: wrong result
Geometric mean 0.28x

Gate: within tolerance against scripts/flutter-bench/baseline; BEHIND FLUTTER on Compute (geomean of the VM workloads) (reported, not gated: a loss to Flutter on the web is currently accepted).

the JavaScript adapter needs a Chrome DevTools driver; sizes are reported and timings are not
This platform's adapter has not been exercised end to end before; treat the first published run as the thing under review.

linux

9 interleaved rounds; host load 0.24, 3.14, 2.8

Metric Codename One Flutter Ratio Winner
Installed size 113.5 MB 143.8 MB 1.27x Codename One
Executable code 15.8 MB 16.1 MB 1.02x Codename One
Download size (zipped) 81.7 MB 92.9 MB 1.14x Codename One
Cold start to first frame on screen 181 ms 243 ms 1.32x Codename One
Memory at rest 90.5 MB 226.0 MB 2.49x Codename One

Start-up and memory at rest are judged round by round: the ratio is the median of the per-round ratios, each from two launches made back to back, and the times and sizes shown are each side's median, so the ratio need not equal their quotient. Codename One was ahead in 9 of 9 rounds on cold start to first frame on screen; 9 of 9 rounds on memory at rest.

Compute -- the VM workloads (vm/benchmarks), run inside each app; time is the best of the app's own repetitions, higher ratio means Codename One is faster.

Workload Codename One Flutter Ratio
intArithmetic 74 ms 183 ms 2.47x
longArithmetic 56 ms 56 ms 1.00x
mathTranscendental 239 ms 271 ms 1.13x
arraySequential 15 ms 35 ms 2.33x
arrayRandom 294 ms 348 ms 1.18x
objectAllocation 30 ms 39 ms 1.30x
valueEscape 5 ms 7 ms 1.40x
hashMapChurn 46 ms 330 ms 7.17x
stringBuilding 33 ms 118 ms 3.58x
recursion 92 ms 258 ms 2.80x
quicksortBench 141 ms 149 ms 1.06x
Geometric mean 1.89x

Gate: within tolerance against scripts/flutter-bench/baseline.

This platform's adapter has not been exercised end to end before; treat the first published run as the thing under review.

macos

9 interleaved rounds; host load 3.44, 11.56, 11.27

Metric Codename One Flutter Ratio Winner
Installed size 124.6 MB 139.4 MB 1.12x Codename One
Executable code 33.5 MB 47.9 MB 1.43x Codename One
Download size (zipped) 85.6 MB 93.3 MB 1.09x Codename One
Cold start to first frame on screen 250 ms 378 ms 1.48x Codename One
Memory at rest 34.6 MB 52.2 MB 1.50x Codename One

Start-up and memory at rest are judged round by round: the ratio is the median of the per-round ratios, each from two launches made back to back, and the times and sizes shown are each side's median, so the ratio need not equal their quotient. Codename One was ahead in 9 of 9 rounds on cold start to first frame on screen; 9 of 9 rounds on memory at rest.

Compute -- the VM workloads (vm/benchmarks), run inside each app; time is the best of the app's own repetitions, higher ratio means Codename One is faster.

Workload Codename One Flutter Ratio
intArithmetic 107 ms 245 ms 2.29x
longArithmetic 67 ms 67 ms 1.00x
mathTranscendental 296 ms 314 ms 1.06x
arraySequential 12 ms 42 ms 3.50x
arrayRandom 286 ms 306 ms 1.07x
objectAllocation 31 ms 27 ms 0.87x
valueEscape 5 ms 13 ms 2.60x
hashMapChurn 29 ms 161 ms 5.55x
stringBuilding 29 ms 111 ms 3.83x
recursion 136 ms 263 ms 1.93x
quicksortBench 116 ms 132 ms 1.14x
Geometric mean 1.87x

Gate: within tolerance against scripts/flutter-bench/baseline.

This platform's adapter has not been exercised end to end before; treat the first published run as the thing under review.

windows

9 interleaved rounds

Metric Codename One Flutter Ratio Winner
Installed size 108.4 MB 121.1 MB 1.12x Codename One
Executable code 11.8 MB 14.1 MB 1.20x Codename One
Download size (zipped) 78.1 MB 86.4 MB 1.11x Codename One
Cold start to first frame on screen 157 ms 251 ms 1.59x Codename One
Memory at rest 57.2 MB 93.2 MB 1.62x Codename One

Start-up and memory at rest are judged round by round: the ratio is the median of the per-round ratios, each from two launches made back to back, and the times and sizes shown are each side's median, so the ratio need not equal their quotient. Codename One was ahead in 9 of 9 rounds on cold start to first frame on screen; 9 of 9 rounds on memory at rest.

Compute -- the VM workloads (vm/benchmarks), run inside each app; time is the best of the app's own repetitions, higher ratio means Codename One is faster.

Workload Codename One Flutter Ratio
intArithmetic 80 ms 183 ms 2.29x
longArithmetic 60 ms 58 ms 0.97x
mathTranscendental 199 ms 270 ms 1.36x
arraySequential 11 ms 35 ms 3.18x
arrayRandom 256 ms 366 ms 1.43x
objectAllocation 24 ms 39 ms 1.62x
valueEscape 1 ms 7 ms 7.00x
hashMapChurn 48 ms 307 ms 6.40x
stringBuilding 38 ms 119 ms 3.13x
recursion 218 ms 255 ms 1.17x
quicksortBench 149 ms 146 ms 0.98x
Geometric mean 2.10x

Gate: within tolerance against scripts/flutter-bench/baseline.

This platform's adapter has not been exercised end to end before; treat the first published run as the thing under review.

Codename One wins 26 of 26 measured metrics across 6 platform(s).

@github-actions

github-actions Bot commented Oct 30, 2026 •

Copy link
Copy Markdown
Contributor

Developer Guide build artifacts are available for download from this workflow run:

Developer Guide quality checks:

  • AsciiDoc linter: No issues found (report)
  • Vale: No alerts found (report)
  • Paragraph capitalization: No paragraph capitalization issues (report)
  • LanguageTool: No grammar matches (report)
  • Image references: No unused images detected (report)

Co-Authored-By: Claude Opus 5.5 <noreply@anthropic.com>
@shai-almog

shai-almog commented Oct 31, 2026 •

Copy link
Copy Markdown
Collaborator Author

Compared 195 screenshots: 195 matched.

Native Android coverage

  • 📊 Line coverage: 19.19% (56038/292047 lines covered) [HTML preview] (artifact android-coverage-report, jacocoAndroidReport/html/index.html)
    • Other counters: instruction 18.14% (269997/1488151), branch 12.40% (19633/158314), complexity 10.36% (15811/152567), method 15.72% (11379/72383), class 27.88% (2235/8017)
    • Lowest covered classes
      • kotlin.collections.unsigned.kotlin.collections.unsigned.UArraysKt___UArraysKt – 0.00% (0/2396 lines covered)
      • org.jacoco.agent.rt.internal_0e20598.asm.org.jacoco.agent.rt.internal_0e20598.asm.ClassReader – 0.00% (0/1524 lines covered)
      • androidx.compose.runtime.androidx.compose.runtime.LinkComposer – 0.00% (0/1430 lines covered)
      • org.jacoco.agent.rt.internal_0e20598.asm.org.jacoco.agent.rt.internal_0e20598.asm.MethodWriter – 0.00% (0/922 lines covered)
      • kotlinx.coroutines.channels.kotlinx.coroutines.channels.BufferedChannel – 0.00% (0/863 lines covered)
      • kotlin.sequences.kotlin.sequences.SequencesKt___SequencesKt – 0.00% (0/744 lines covered)
      • com.google.common.cache.com.google.common.cache.LocalCache$Segment – 0.00% (0/726 lines covered)
      • okio.okio.Buffer – 0.00% (0/687 lines covered)
      • kotlin.text.kotlin.text.StringsKt___StringsKt – 0.00% (0/630 lines covered)
      • com.codename1.androidcompat.rt.com.codename1.androidcompat.rt.TextXmlPullParser – 0.00% (0/623 lines covered)

✅ Native Android screenshot tests passed.

Native Android coverage

  • 📊 Line coverage: 19.19% (56038/292047 lines covered) [HTML preview] (artifact android-coverage-report, jacocoAndroidReport/html/index.html)
    • Other counters: instruction 18.14% (269997/1488151), branch 12.40% (19633/158314), complexity 10.36% (15811/152567), method 15.72% (11379/72383), class 27.88% (2235/8017)
    • Lowest covered classes
      • kotlin.collections.unsigned.kotlin.collections.unsigned.UArraysKt___UArraysKt – 0.00% (0/2396 lines covered)
      • org.jacoco.agent.rt.internal_0e20598.asm.org.jacoco.agent.rt.internal_0e20598.asm.ClassReader – 0.00% (0/1524 lines covered)
      • androidx.compose.runtime.androidx.compose.runtime.LinkComposer – 0.00% (0/1430 lines covered)
      • org.jacoco.agent.rt.internal_0e20598.asm.org.jacoco.agent.rt.internal_0e20598.asm.MethodWriter – 0.00% (0/922 lines covered)
      • kotlinx.coroutines.channels.kotlinx.coroutines.channels.BufferedChannel – 0.00% (0/863 lines covered)
      • kotlin.sequences.kotlin.sequences.SequencesKt___SequencesKt – 0.00% (0/744 lines covered)
      • com.google.common.cache.com.google.common.cache.LocalCache$Segment – 0.00% (0/726 lines covered)
      • okio.okio.Buffer – 0.00% (0/687 lines covered)
      • kotlin.text.kotlin.text.StringsKt___StringsKt – 0.00% (0/630 lines covered)
      • com.codename1.androidcompat.rt.com.codename1.androidcompat.rt.TextXmlPullParser – 0.00% (0/623 lines covered)

Benchmark Results

Detailed Performance Metrics

Metric Duration
SIMD kernel backend scalar fallback (no native SIMD)
SIMD int-add (64K x300) java 188ms / native 130ms = 1.4x speedup
SIMD float-mul (64K x300) java 134ms / native 117ms = 1.1x speedup
SIMD kernel correctness PASS (native result == scalar reference)
Base64 payload size 8192 bytes
Base64 benchmark iterations 6000
Base64 SIMD byte path gated to scalar (CPU autovectorizes scalar; explicit SIMD not beneficial here)
Base64 CN1 encode 72.000 ms
Base64 CN1 decode 84.000 ms
Base64 native encode 400.000 ms
Base64 encode ratio (CN1/native) 0.180x (82.0% faster)
Base64 native decode 278.000 ms
Base64 decode ratio (CN1/native) 0.302x (69.8% faster)
Image encode benchmark status skipped (SIMD unsupported)

@shai-almog

shai-almog commented Oct 31, 2026 •

Copy link
Copy Markdown
Collaborator Author

Compared 210 screenshots: 210 matched.
Native Windows port, REAL shipping pipeline: the hellocodenameone screenshot suite rendered by a binary CROSS-COMPILED on Linux (clang-cl + xwin, WebView2 linked) and RUN on a Windows x64 runner. Compared against the in-repo baseline in scripts/windows/screenshots.

Benchmark Results

Detailed Performance Metrics

Metric Duration
SIMD kernel backend SSE2 (x64) / NEON (arm64) native kernels
SIMD int-add (64K x300) java 44ms / native 3ms = 14.6x speedup
SIMD float-mul (64K x300) java 43ms / native 3ms = 14.3x speedup
SIMD kernel correctness PASS (native result == scalar reference)
Base64 native bridge unavailable (CN1 + SIMD + image benchmarks only)
Base64 payload size 8192 bytes
Base64 benchmark iterations 6000
Base64 SIMD byte path gated to scalar (CPU autovectorizes scalar; explicit SIMD not beneficial here)
Base64 CN1 encode 61.000 ms
Base64 CN1 decode 72.000 ms
Base64 SIMD encode 91.000 ms
Base64 encode ratio (SIMD/CN1) 1.492x (49.2% slower)
Base64 SIMD decode 76.000 ms
Base64 decode ratio (SIMD/CN1) 1.056x (5.6% slower)
Image encode benchmark iterations 100
Image createMask (SIMD off) 6.000 ms
Image createMask (SIMD on) 4.000 ms
Image createMask ratio (SIMD on/off) 0.667x (33.3% faster)
Image applyMask (SIMD off) 22.000 ms
Image applyMask (SIMD on) 25.000 ms
Image applyMask ratio (SIMD on/off) 1.136x (13.6% slower)
Image modifyAlpha (SIMD off) 28.000 ms
Image modifyAlpha (SIMD on) 18.000 ms
Image modifyAlpha ratio (SIMD on/off) 0.643x (35.7% faster)
Image modifyAlpha removeColor (SIMD off) 28.000 ms
Image modifyAlpha removeColor (SIMD on) 12.000 ms
Image modifyAlpha removeColor ratio (SIMD on/off) 0.429x (57.1% faster)

@shai-almog

shai-almog commented Oct 31, 2026 •

Copy link
Copy Markdown
Collaborator Author

Compared 210 screenshots: 210 matched.
Native Windows port (x64 / Intel-AMD): full hellocodenameone screenshot suite rendered offscreen with Direct2D/DirectWrite, plus the real benchmarks (base64 native/CN1/SIMD, image createMask/applyMask/modifyAlpha/PNG/JPEG, SSE2 SIMD kernels). Compared against the in-repo baseline in scripts/windows/screenshots.

Benchmark Results

Detailed Performance Metrics

Metric Duration
SIMD kernel backend SSE2 (x64) / NEON (arm64) native kernels
SIMD int-add (64K x300) java 50ms / native 4ms = 12.5x speedup
SIMD float-mul (64K x300) java 51ms / native 4ms = 12.7x speedup
SIMD kernel correctness PASS (native result == scalar reference)
Base64 native bridge unavailable (CN1 + SIMD + image benchmarks only)
Base64 payload size 8192 bytes
Base64 benchmark iterations 6000
Base64 SIMD byte path gated to scalar (CPU autovectorizes scalar; explicit SIMD not beneficial here)
Base64 CN1 encode 63.000 ms
Base64 CN1 decode 74.000 ms
Base64 SIMD encode 92.000 ms
Base64 encode ratio (SIMD/CN1) 1.460x (46.0% slower)
Base64 SIMD decode 80.000 ms
Base64 decode ratio (SIMD/CN1) 1.081x (8.1% slower)
Image encode benchmark iterations 100
Image createMask (SIMD off) 7.000 ms
Image createMask (SIMD on) 3.000 ms
Image createMask ratio (SIMD on/off) 0.429x (57.1% faster)
Image applyMask (SIMD off) 31.000 ms
Image applyMask (SIMD on) 41.000 ms
Image applyMask ratio (SIMD on/off) 1.323x (32.3% slower)
Image modifyAlpha (SIMD off) 42.000 ms
Image modifyAlpha (SIMD on) 20.000 ms
Image modifyAlpha ratio (SIMD on/off) 0.476x (52.4% faster)
Image modifyAlpha removeColor (SIMD off) 31.000 ms
Image modifyAlpha removeColor (SIMD on) 13.000 ms
Image modifyAlpha removeColor ratio (SIMD on/off) 0.419x (58.1% faster)

ParparVM vs HotSpot (JDK 25): Windows x64

Runner CPU: AMD64 Family 25 Model 17 Stepping 1, AuthenticAMD (baseline windows-x64@amd64-family-25-model-17-authenticamd)

Ratios are ParparVM / JDK 25: below 1.00x ParparVM is faster (time) or smaller (RAM). Median of 5 interleaved, paired rounds; every run's output was verified. A ratio more than 20% (time) / 25% (RAM) above its baseline in vm/selfhost/perf-baseline/ is a regression and fails; one that far below is an improvement, reported but not failed (a row whose calibration runs were noisier carries a wider tolerance), and for RAM the change must also exceed 0.05x in absolute terms. Both run unpinned on all of the runner's CPUs, with their own default thread counts.

Benchmark Cores Time RAM Status
hello (WinHelloMain) 4 1.41x (base 1.38x, +2.6%) 0.69x (base 0.82x, -15.8%) ok
translator (self) 4 0.83x (base 0.89x, -6.7%) 0.51x (base 0.55x, -7.5%) ok
intArithmetic 4 1.10x (base 1.10x, +0.4%) 0.06x (base 0.06x, -0.9%) ok
longArithmetic 4 1.08x (base 1.08x, +0.0%) 0.06x (base 0.06x, +1.2%) ok
mathTranscendental 4 0.85x (base 0.85x, +0.4%) 0.06x (base 0.06x, +4.0%) ok
arraySequential 4 1.81x (base 1.72x, +5.6%) 0.38x (base 0.38x, +0.2%) ok
arrayRandom 4 1.03x (base 1.01x, +1.4%) 0.23x (base 0.23x, +0.5%) ok
objectAllocation 4 1.25x (base 1.25x, -0.1%) 0.28x (base 0.29x, -3.6%) ok
valueEscape 4 0.10x (base 0.10x, -1.3%) 0.05x (base 0.04x, +3.6%) ok
hashMapChurn 4 1.37x (base 1.39x, -1.8%) 0.10x (base 0.10x, +4.3%) ok
stringBuilding 4 1.40x (base 1.36x, +3.5%) 0.32x (base 0.28x, +16.0%) ok
recursion 4 1.38x (base 1.43x, -3.5%) 0.06x (base 0.06x, +2.9%) ok
quicksort 4 1.11x (base 1.11x, -0.6%) 0.12x (base 0.12x, +0.6%) ok

Result: no regression

@shai-almog

shai-almog commented Oct 31, 2026 •

Copy link
Copy Markdown
Collaborator Author

Compared 196 screenshots: 196 matched.
✅ Native Mac screenshot tests passed.

Benchmark Results

  • VM Translation Time: 0 seconds
  • Compilation Time: 770 seconds

Detailed Performance Metrics

Metric Duration
SIMD kernel backend SSE2 (x64) / NEON (arm64) native kernels
SIMD int-add (64K x300) java 60ms / native 2ms = 30.0x speedup
SIMD float-mul (64K x300) java 61ms / native 3ms = 20.3x speedup
SIMD kernel correctness PASS (native result == scalar reference)
Base64 native bridge unavailable (CN1 + SIMD + image benchmarks only)
Base64 payload size 8192 bytes
Base64 benchmark iterations 6000
Base64 SIMD byte path active (NEON-accelerated)
Base64 CN1 encode 56.000 ms
Base64 CN1 decode 67.000 ms
Image encode benchmark iterations 100
Image createMask (SIMD off) 8.000 ms
Image createMask (SIMD on) 5.000 ms
Image createMask ratio (SIMD on/off) 0.625x (37.5% faster)
Image applyMask (SIMD off) 61.000 ms
Image applyMask (SIMD on) 67.000 ms
Image applyMask ratio (SIMD on/off) 1.098x (9.8% slower)
Image modifyAlpha (SIMD off) 81.000 ms
Image modifyAlpha (SIMD on) 54.000 ms
Image modifyAlpha ratio (SIMD on/off) 0.667x (33.3% faster)
Image modifyAlpha removeColor (SIMD off) 72.000 ms
Image modifyAlpha removeColor (SIMD on) 50.000 ms
Image modifyAlpha removeColor ratio (SIMD on/off) 0.694x (30.6% faster)

ParparVM vs HotSpot (JDK 25): macOS arm64

Runner CPU: Apple M1 (Virtual) (baseline macos-arm64)

Ratios are ParparVM / JDK 25: below 1.00x ParparVM is faster (time) or smaller (RAM). Median of 5 interleaved, paired rounds; every run's output was verified. A ratio more than 20% (time) / 25% (RAM) above its baseline in vm/selfhost/perf-baseline/ is a regression and fails; one that far below is an improvement, reported but not failed (a row whose calibration runs were noisier carries a wider tolerance), and for RAM the change must also exceed 0.05x in absolute terms. Both run unpinned on all of the runner's CPUs, with their own default thread counts.

Benchmark Cores Time RAM Status
hello (HelloCodenameOne) 3 1.08x (base 0.96x, +12.6%) 0.84x (base 0.93x, -9.2%) ok
translator (self) 3 0.59x (base 0.62x, -4.8%) 0.75x (base 0.78x, -4.0%) ok
intArithmetic 3 1.05x (base 1.03x, +2.1%) 0.12x (base 0.12x, +1.6%) ok
longArithmetic 3 0.99x (base 1.03x, -3.3%) 0.12x (base 0.07x, +66.3%) ok
mathTranscendental 3 1.01x (base 1.01x, -0.0%) 0.12x (base 0.12x, +0.5%) ok
arraySequential 3 0.44x (base 0.42x, +5.4%) 0.53x (base 0.53x, +0.3%) ok
arrayRandom 3 0.98x (base 0.99x, -1.3%) 0.32x (base 0.32x, +0.0%) ok
objectAllocation 3 1.05x (base 1.11x, -5.5%) 0.82x (base 0.72x, +13.0%) ok
valueEscape 3 0.51x (base 0.51x, +1.1%) 0.08x (base 0.09x, -10.2%) ok
hashMapChurn 3 1.09x (base 1.18x, -7.5%) 0.07x (base 0.07x, +4.1%) ok
stringBuilding 3 0.91x (base 0.84x, +7.6%) 0.46x (base 0.46x, -0.3%) ok
recursion 3 1.23x (base 1.24x, -0.2%) 0.12x (base 0.12x, +0.7%) ok
quicksort 3 0.99x (base 1.01x, -2.0%) 0.11x (base 0.11x, +1.6%) ok

Result: no regression

@shai-almog

shai-almog commented Oct 31, 2026 •

Copy link
Copy Markdown
Collaborator Author

Compared 210 screenshots: 210 matched.
Native Linux port (x64), GTK3/Cairo/Pango, ParparVM bytecode-to-C (no JVM): the hellocodenameone screenshot suite rendered by a native ELF built + run on the GitHub x64 runner. Baseline: scripts/linux/screenshots.

ParparVM vs HotSpot (JDK 25): Linux x64

Runner CPU: AMD EPYC 9V45 96-Core Processor (baseline linux-x64@amd-epyc-9v45-96-core-processor)

Ratios are ParparVM / JDK 25: below 1.00x ParparVM is faster (time) or smaller (RAM). Median of 5 interleaved, paired rounds; every run's output was verified. A ratio more than 20% (time) / 25% (RAM) above its baseline in vm/selfhost/perf-baseline/ is a regression and fails; one that far below is an improvement, reported but not failed (a row whose calibration runs were noisier carries a wider tolerance), and for RAM the change must also exceed 0.05x in absolute terms. Both run unpinned on all of the runner's CPUs, with their own default thread counts.

Benchmark Cores Time RAM Status
hello (LinuxHelloMain) 4 1.00x (base 0.92x, +9.0%) 0.86x (base 0.84x, +2.9%) ok
translator (self) 4 0.62x (base 0.64x, -3.8%) 0.58x (base 0.55x, +6.3%) ok
intArithmetic 4 1.00x (base 1.00x, +0.1%) 0.04x (base 0.06x, -33.3%) ok
longArithmetic 4 0.99x (base 0.99x, -0.0%) 0.04x (base 0.07x, -47.7%) ok
mathTranscendental 4 1.19x (base 1.20x, -0.5%) 0.04x (base 0.06x, -28.3%) ok
arraySequential 4 3.02x (base 2.91x, +3.8%) 0.36x (base 0.36x, +1.1%) ok
arrayRandom 4 0.98x (base 1.04x, -5.5%) 0.20x (base 0.23x, -10.8%) ok
objectAllocation 4 1.53x (base 1.61x, -5.0%) 0.23x (base 0.24x, -2.7%) ok
valueEscape 4 0.10x (base 0.12x, -15.9%) 0.03x (base 0.04x, -19.6%) ok
hashMapChurn 4 1.41x (base 1.31x, +7.7%) 0.09x (base 0.09x, +7.6%) ok
stringBuilding 4 1.53x (base 1.58x, -3.2%) 0.26x (base 0.22x, +20.0%) ok
recursion 4 1.34x (base 1.34x, +0.1%) 0.04x (base 0.08x, -48.0%) ok
quicksort 4 1.05x (base 1.06x, -1.3%) 0.10x (base 0.11x, -11.0%) ok

Result: no regression

@shai-almog

shai-almog commented Oct 31, 2026 •

Copy link
Copy Markdown
Collaborator Author

Compared 210 screenshots: 210 matched.
Native Linux port (arm64), GTK3/Cairo/Pango, ParparVM bytecode-to-C (no JVM): the hellocodenameone screenshot suite rendered by a native ELF built + run on the GitHub arm64 runner. Baseline: scripts/linux/screenshots-arm.

ParparVM vs HotSpot (JDK 25): Linux arm64

Runner CPU: Neoverse-N2 (baseline linux-arm64@neoverse-n2)

Ratios are ParparVM / JDK 25: below 1.00x ParparVM is faster (time) or smaller (RAM). Median of 5 interleaved, paired rounds; every run's output was verified. A ratio more than 20% (time) / 25% (RAM) above its baseline in vm/selfhost/perf-baseline/ is a regression and fails; one that far below is an improvement, reported but not failed (a row whose calibration runs were noisier carries a wider tolerance), and for RAM the change must also exceed 0.05x in absolute terms. Both run unpinned on all of the runner's CPUs, with their own default thread counts.

Benchmark Cores Time RAM Status
hello (LinuxHelloMain) 4 1.00x (base 1.02x, -1.8%) 0.77x (base 0.66x, +16.8%) ok
translator (self) 4 0.78x (base 0.70x, +11.0%) 0.44x (base 0.43x, +2.9%) ok
intArithmetic 4 1.04x (base 1.04x, -0.0%) 0.03x (base 0.03x, +4.5%) ok
longArithmetic 4 0.79x (base 0.79x, -0.0%) 0.03x (base 0.03x, +5.2%) ok
mathTranscendental 4 1.10x (base 1.10x, -0.2%) 0.04x (base 0.03x, +9.5%) ok
arraySequential 4 0.40x (base 0.36x, +11.7%) 0.37x (base 0.37x, +0.2%) ok
arrayRandom 4 0.94x (base 0.94x, +0.4%) 0.20x (base 0.20x, +0.7%) ok
objectAllocation 4 1.92x (base 1.77x, +8.4%) 0.41x (base 0.37x, +10.0%) ok
valueEscape 4 0.51x (base 0.51x, -0.1%) 0.03x (base 0.03x, +6.2%) ok
hashMapChurn 4 0.82x (base 0.84x, -2.7%) 0.13x (base 0.12x, +4.6%) ok
stringBuilding 4 1.51x (base 1.57x, -3.5%) 0.26x (base 0.26x, +0.5%) ok
recursion 4 1.54x (base 1.43x, +7.6%) 0.04x (base 0.04x, +3.1%) ok
quicksort 4 1.00x (base 0.99x, +0.3%) 0.09x (base 0.09x, +1.1%) ok

Result: no regression

@shai-almog

shai-almog commented Oct 31, 2026 •

Copy link
Copy Markdown
Collaborator Author

Compared 210 screenshots: 210 matched.
Native Windows port (arm64 / Apple Silicon - Arm): full hellocodenameone screenshot suite rendered offscreen with Direct2D/DirectWrite, plus the real benchmarks (base64 native/CN1/SIMD, image createMask/applyMask/modifyAlpha/PNG/JPEG, NEON SIMD kernels). Compared against the in-repo baseline in scripts/windows/screenshots.

Benchmark Results

Detailed Performance Metrics

Metric Duration
SIMD kernel backend SSE2 (x64) / NEON (arm64) native kernels
SIMD int-add (64K x300) java 54ms / native 3ms = 18.0x speedup
SIMD float-mul (64K x300) java 53ms / native 3ms = 17.6x speedup
SIMD kernel correctness PASS (native result == scalar reference)
Base64 native bridge unavailable (CN1 + SIMD + image benchmarks only)
Base64 payload size 8192 bytes
Base64 benchmark iterations 6000
Base64 SIMD byte path gated to scalar (CPU autovectorizes scalar; explicit SIMD not beneficial here)
Base64 CN1 encode 60.000 ms
Base64 CN1 decode 70.000 ms
Base64 SIMD encode 78.000 ms
Base64 encode ratio (SIMD/CN1) 1.300x (30.0% slower)
Base64 SIMD decode 73.000 ms
Base64 decode ratio (SIMD/CN1) 1.043x (4.3% slower)
Image encode benchmark iterations 100
Image createMask (SIMD off) 5.000 ms
Image createMask (SIMD on) 2.000 ms
Image createMask ratio (SIMD on/off) 0.400x (60.0% faster)
Image applyMask (SIMD off) 17.000 ms
Image applyMask (SIMD on) 16.000 ms
Image applyMask ratio (SIMD on/off) 0.941x (5.9% faster)
Image modifyAlpha (SIMD off) 15.000 ms
Image modifyAlpha (SIMD on) 7.000 ms
Image modifyAlpha ratio (SIMD on/off) 0.467x (53.3% faster)
Image modifyAlpha removeColor (SIMD off) 16.000 ms
Image modifyAlpha removeColor (SIMD on) 11.000 ms
Image modifyAlpha removeColor ratio (SIMD on/off) 0.688x (31.3% faster)

ParparVM vs HotSpot (JDK 25): Windows arm64

Runner CPU: ARMv8 (64-bit) Family 8 Model D49 Revision 0, MICROSOFT CORPORATION (baseline windows-arm64@armv8-64-bit-family-8-model-d49-microsoft-corporation)

Ratios are ParparVM / JDK 25: below 1.00x ParparVM is faster (time) or smaller (RAM). Median of 5 interleaved, paired rounds; every run's output was verified. A ratio more than 20% (time) / 25% (RAM) above its baseline in vm/selfhost/perf-baseline/ is a regression and fails; one that far below is an improvement, reported but not failed (a row whose calibration runs were noisier carries a wider tolerance), and for RAM the change must also exceed 0.05x in absolute terms. Both run unpinned on all of the runner's CPUs, with their own default thread counts.

Benchmark Cores Time RAM Status
hello (WinHelloMain) 4 1.04x (base 1.11x, -5.7%) 0.73x (base 0.75x, -2.9%) ok
translator (self) 4 0.87x (base 0.84x, +3.3%) 0.49x (base 0.51x, -4.0%) ok
intArithmetic 4 1.04x (base 1.04x, -0.0%) 0.06x (base 0.06x, +3.8%) ok
longArithmetic 4 0.79x (base 0.80x, -0.3%) 0.06x (base 0.06x, +4.2%) ok
mathTranscendental 4 0.72x (base 0.72x, -0.5%) 0.07x (base 0.06x, +2.4%) ok
arraySequential 4 0.35x (base 0.46x, -22.7%) 0.39x (base 0.39x, +0.1%) ok
arrayRandom 4 0.94x (base 0.94x, +0.5%) 0.23x (base 0.23x, +0.4%) ok
objectAllocation 4 1.71x (base 1.82x, -6.1%) 0.30x (base 0.43x, -31.3%) ok
valueEscape 4 0.76x (base 0.76x, +0.0%) 0.05x (base 0.05x, +3.7%) ok
hashMapChurn 4 0.98x (base 0.98x, -0.6%) 0.12x (base 0.12x, -2.5%) ok
stringBuilding 4 1.52x (base 1.43x, +6.9%) 0.27x (base 0.27x, -0.2%) ok
recursion 4 1.42x (base 1.46x, -3.0%) 0.07x (base 0.07x, +1.9%) ok
quicksort 4 1.00x (base 1.00x, +0.2%) 0.12x (base 0.12x, +0.9%) ok

Result: no regression

@shai-almog

shai-almog commented Oct 31, 2026 •

Copy link
Copy Markdown
Collaborator Author

Compared 192 screenshots: 192 matched.
✅ Native Mac screenshot tests passed.

Benchmark Results

  • VM Translation Time: 0 seconds
  • Compilation Time: 968 seconds

Detailed Performance Metrics

Metric Duration
SIMD kernel backend SSE2 (x64) / NEON (arm64) native kernels
SIMD int-add (64K x300) java 66ms / native 7ms = 9.4x speedup
SIMD float-mul (64K x300) java 59ms / native 2ms = 29.5x speedup
SIMD kernel correctness PASS (native result == scalar reference)
Base64 payload size 8192 bytes
Base64 benchmark iterations 6000
Base64 SIMD byte path active (NEON-accelerated)
Base64 CN1 encode 96.000 ms
Base64 CN1 decode 66.000 ms
Base64 native encode 991.000 ms
Base64 encode ratio (CN1/native) 0.097x (90.3% faster)
Base64 native decode 415.000 ms
Base64 decode ratio (CN1/native) 0.159x (84.1% faster)
Base64 SIMD encode 72.000 ms
Base64 encode ratio (SIMD/CN1) 0.750x (25.0% faster)
Base64 SIMD decode 86.000 ms
Base64 decode ratio (SIMD/CN1) 1.303x (30.3% slower)
Base64 encode ratio (SIMD/native) 0.073x (92.7% faster)
Base64 decode ratio (SIMD/native) 0.207x (79.3% faster)
Image encode benchmark iterations 100
Image createMask (SIMD off) 11.000 ms
Image createMask (SIMD on) 4.000 ms
Image createMask ratio (SIMD on/off) 0.364x (63.6% faster)
Image applyMask (SIMD off) 67.000 ms
Image applyMask (SIMD on) 54.000 ms
Image applyMask ratio (SIMD on/off) 0.806x (19.4% faster)
Image modifyAlpha (SIMD off) 93.000 ms
Image modifyAlpha (SIMD on) 69.000 ms
Image modifyAlpha ratio (SIMD on/off) 0.742x (25.8% faster)
Image modifyAlpha removeColor (SIMD off) 87.000 ms
Image modifyAlpha removeColor (SIMD on) 75.000 ms
Image modifyAlpha removeColor ratio (SIMD on/off) 0.862x (13.8% faster)

@shai-almog

shai-almog commented Oct 31, 2026 •

Copy link
Copy Markdown
Collaborator Author

Apple TV (tvOS / Metal)

Compared 188 screenshots: 171 matched, 13 updated, 4 missing references.

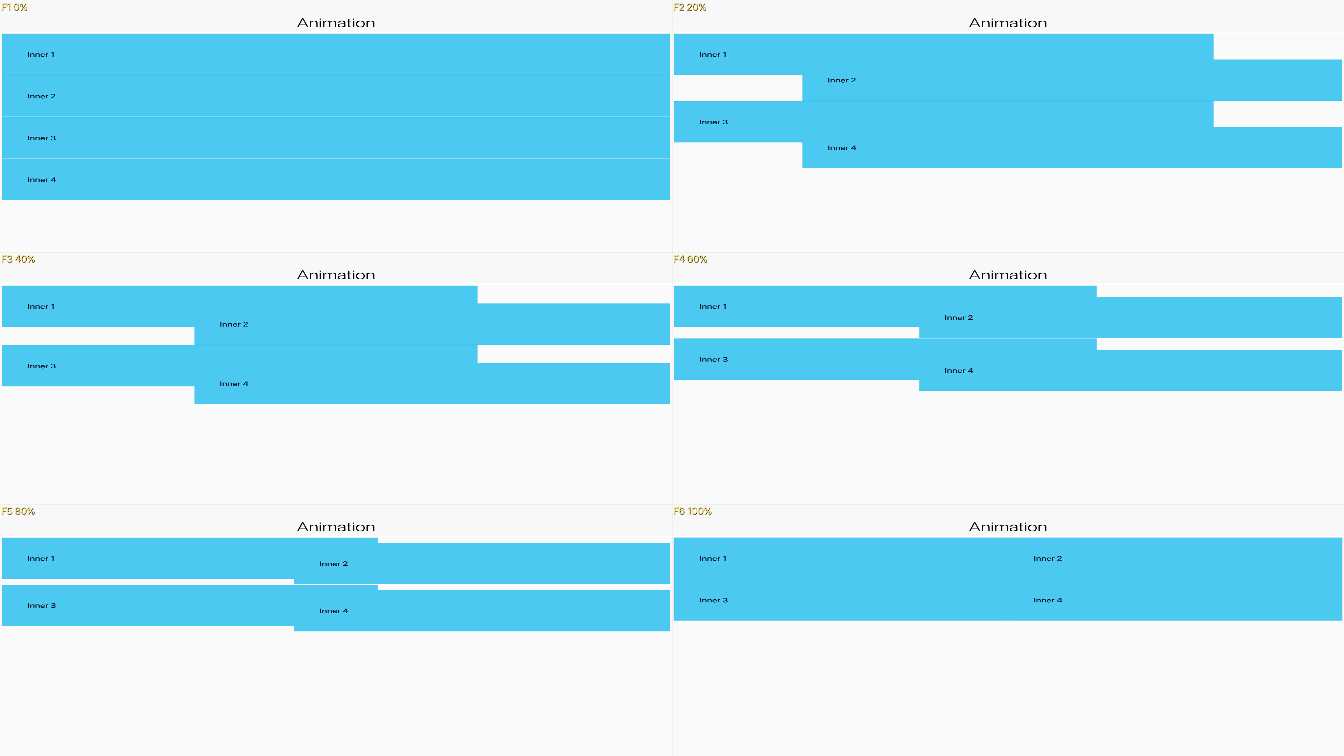
  • AnimateHierarchyScreenshotTest — updated screenshot. Screenshot differs (3840x2160 px, bit depth 8).

    AnimateHierarchyScreenshotTest
    Preview info: JPEG preview quality 50; JPEG preview quality 50; downscaled to 1344x756.
    Full-resolution PNG saved as AnimateHierarchyScreenshotTest.png in workflow artifacts.

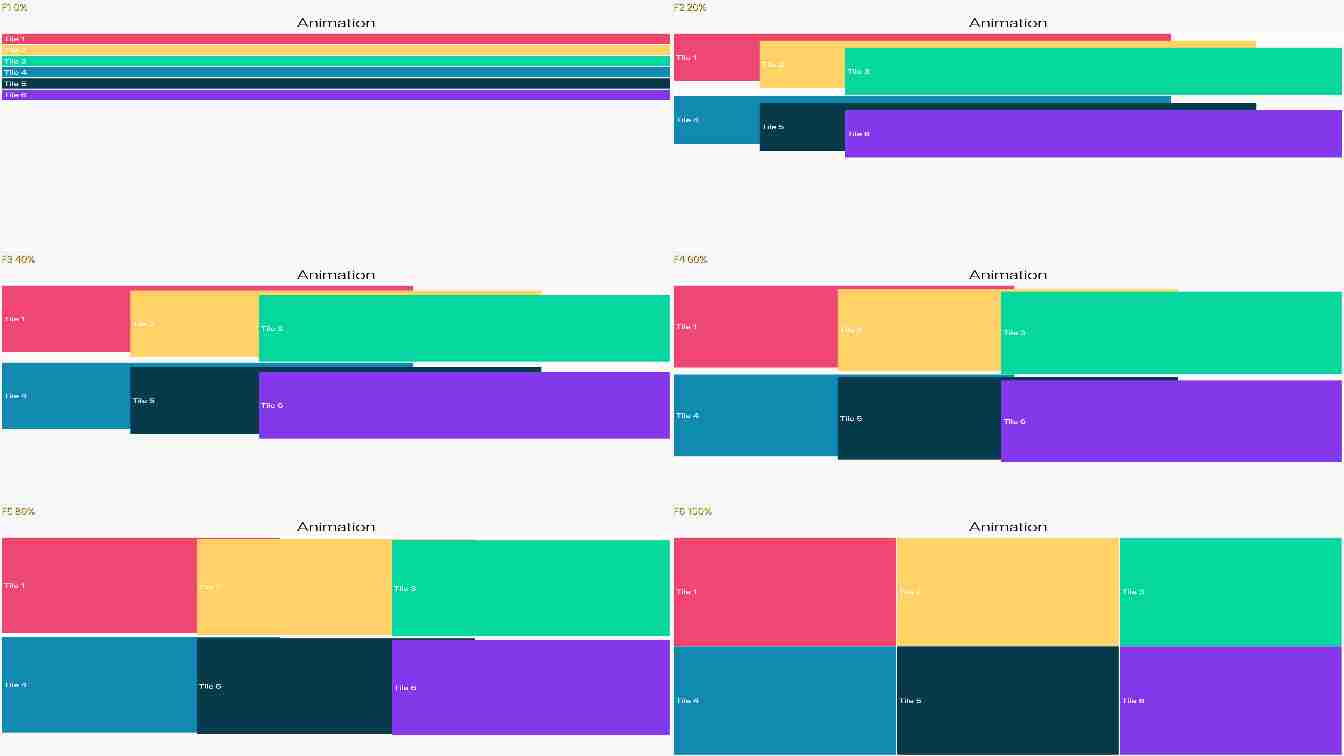
  • AnimateLayoutScreenshotTest — updated screenshot. Screenshot differs (3840x2160 px, bit depth 8).

    AnimateLayoutScreenshotTest
    Preview info: JPEG preview quality 20; JPEG preview quality 20; downscaled to 1344x756.
    Full-resolution PNG saved as AnimateLayoutScreenshotTest.png in workflow artifacts.

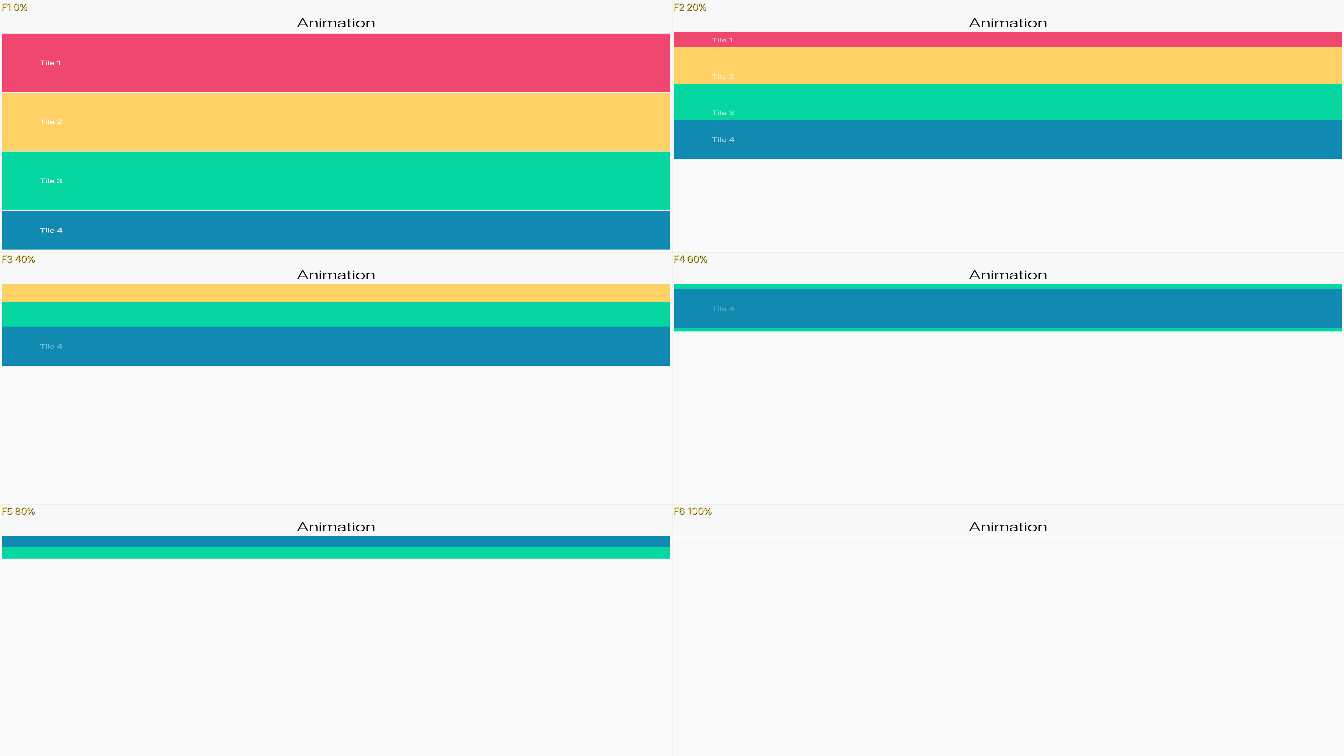
  • AnimateUnlayoutScreenshotTest — updated screenshot. Screenshot differs (3840x2160 px, bit depth 8).

    AnimateUnlayoutScreenshotTest
    Preview info: JPEG preview quality 50; JPEG preview quality 50; downscaled to 1344x756.
    Full-resolution PNG saved as AnimateUnlayoutScreenshotTest.png in workflow artifacts.

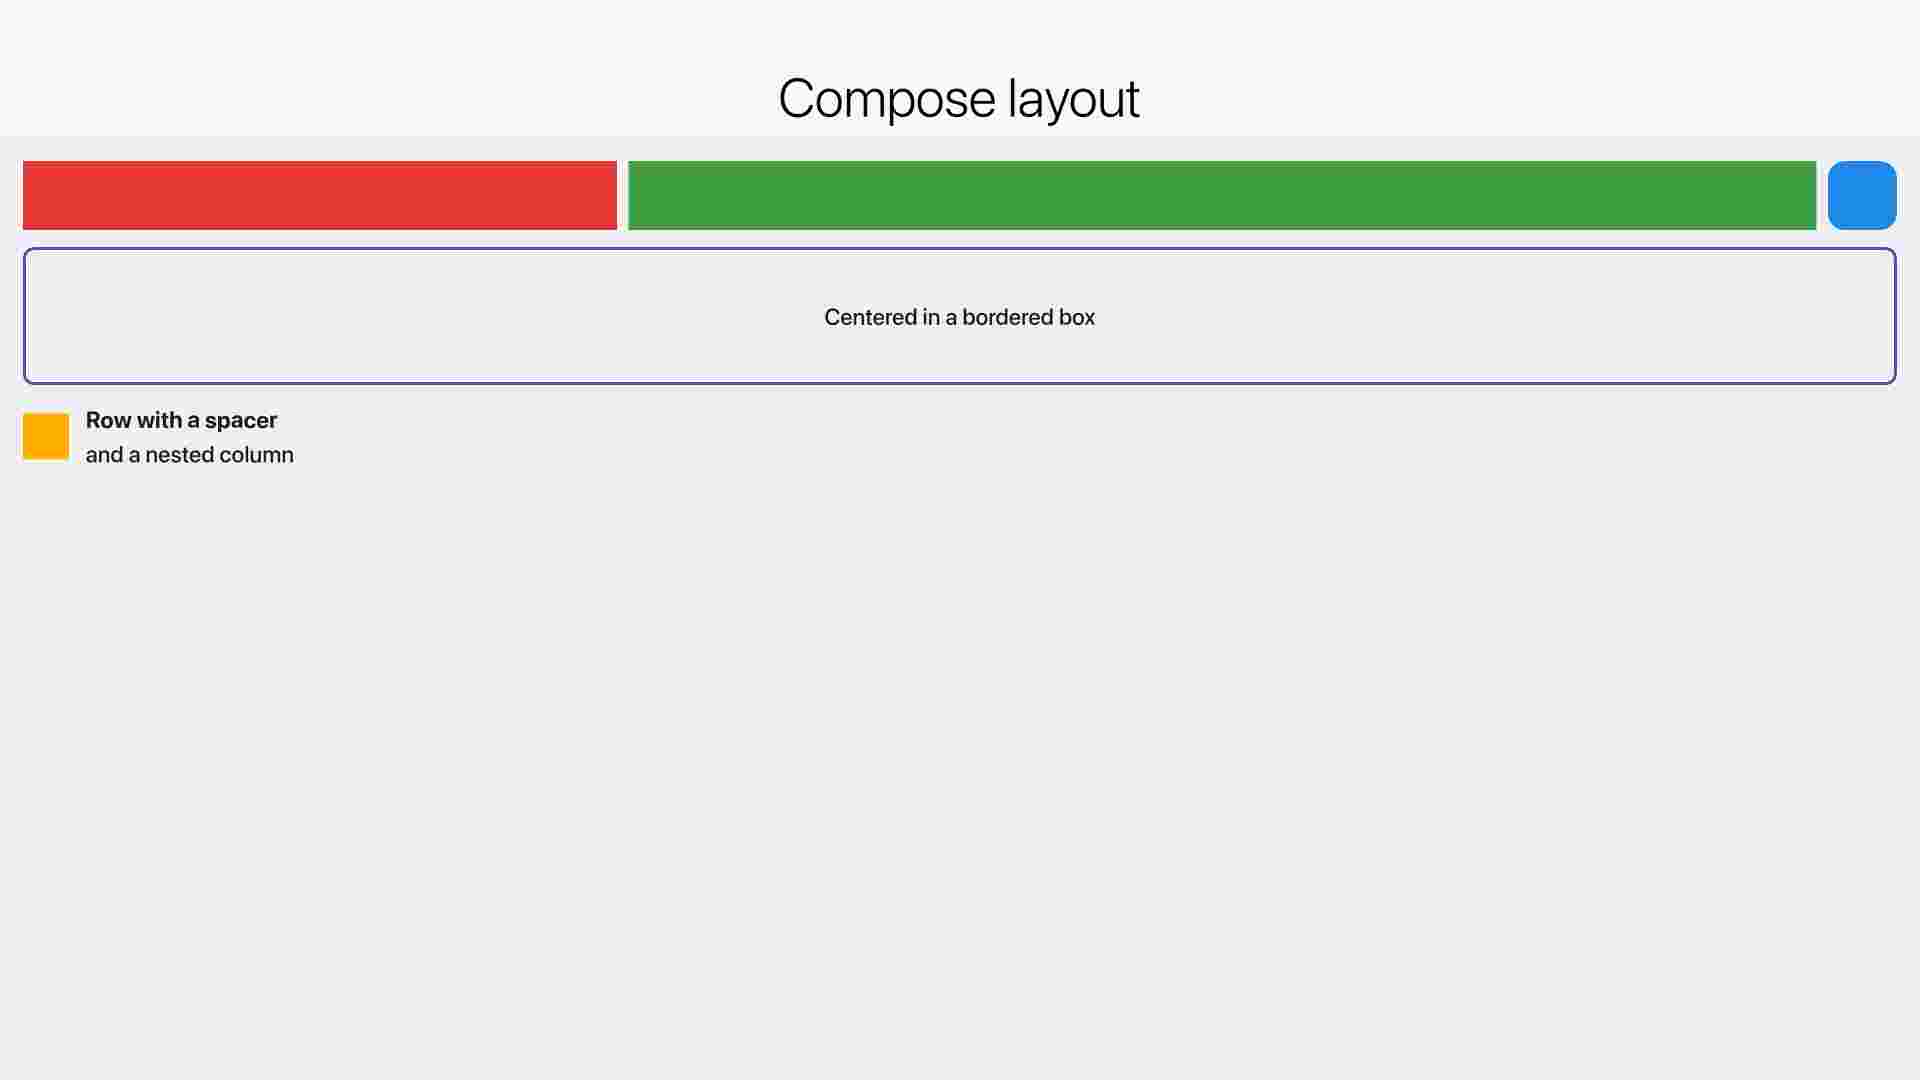
  • KmpCompatLayout — missing reference. Reference screenshot missing at /Users/runner/work/CodenameOne/CodenameOne/scripts/ios/screenshots-tv/KmpCompatLayout.png.

    KmpCompatLayout
    Preview info: JPEG preview quality 10; JPEG preview quality 10; downscaled to 1920x1080.
    Full-resolution PNG saved as KmpCompatLayout.png in workflow artifacts.

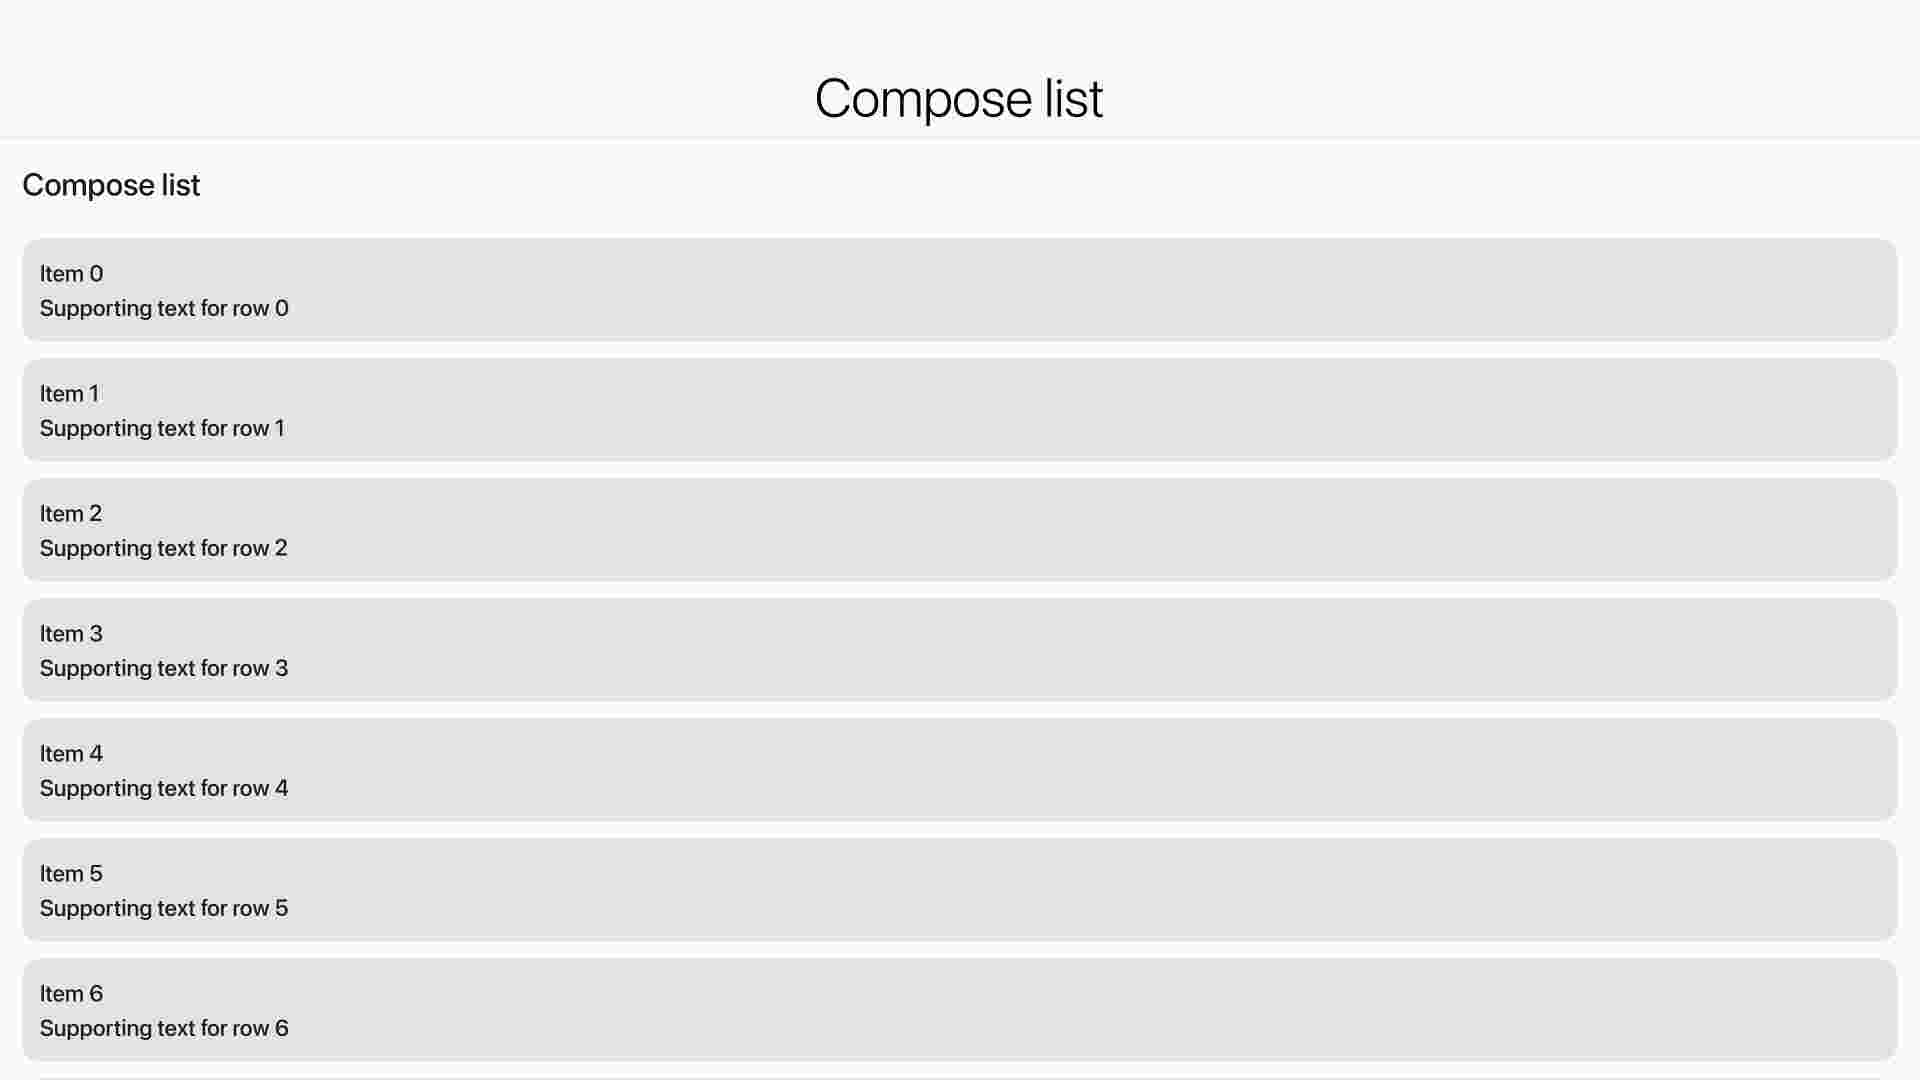
  • KmpCompatList — missing reference. Reference screenshot missing at /Users/runner/work/CodenameOne/CodenameOne/scripts/ios/screenshots-tv/KmpCompatList.png.

    KmpCompatList
    Preview info: JPEG preview quality 10; JPEG preview quality 10; downscaled to 1920x1080.
    Full-resolution PNG saved as KmpCompatList.png in workflow artifacts.

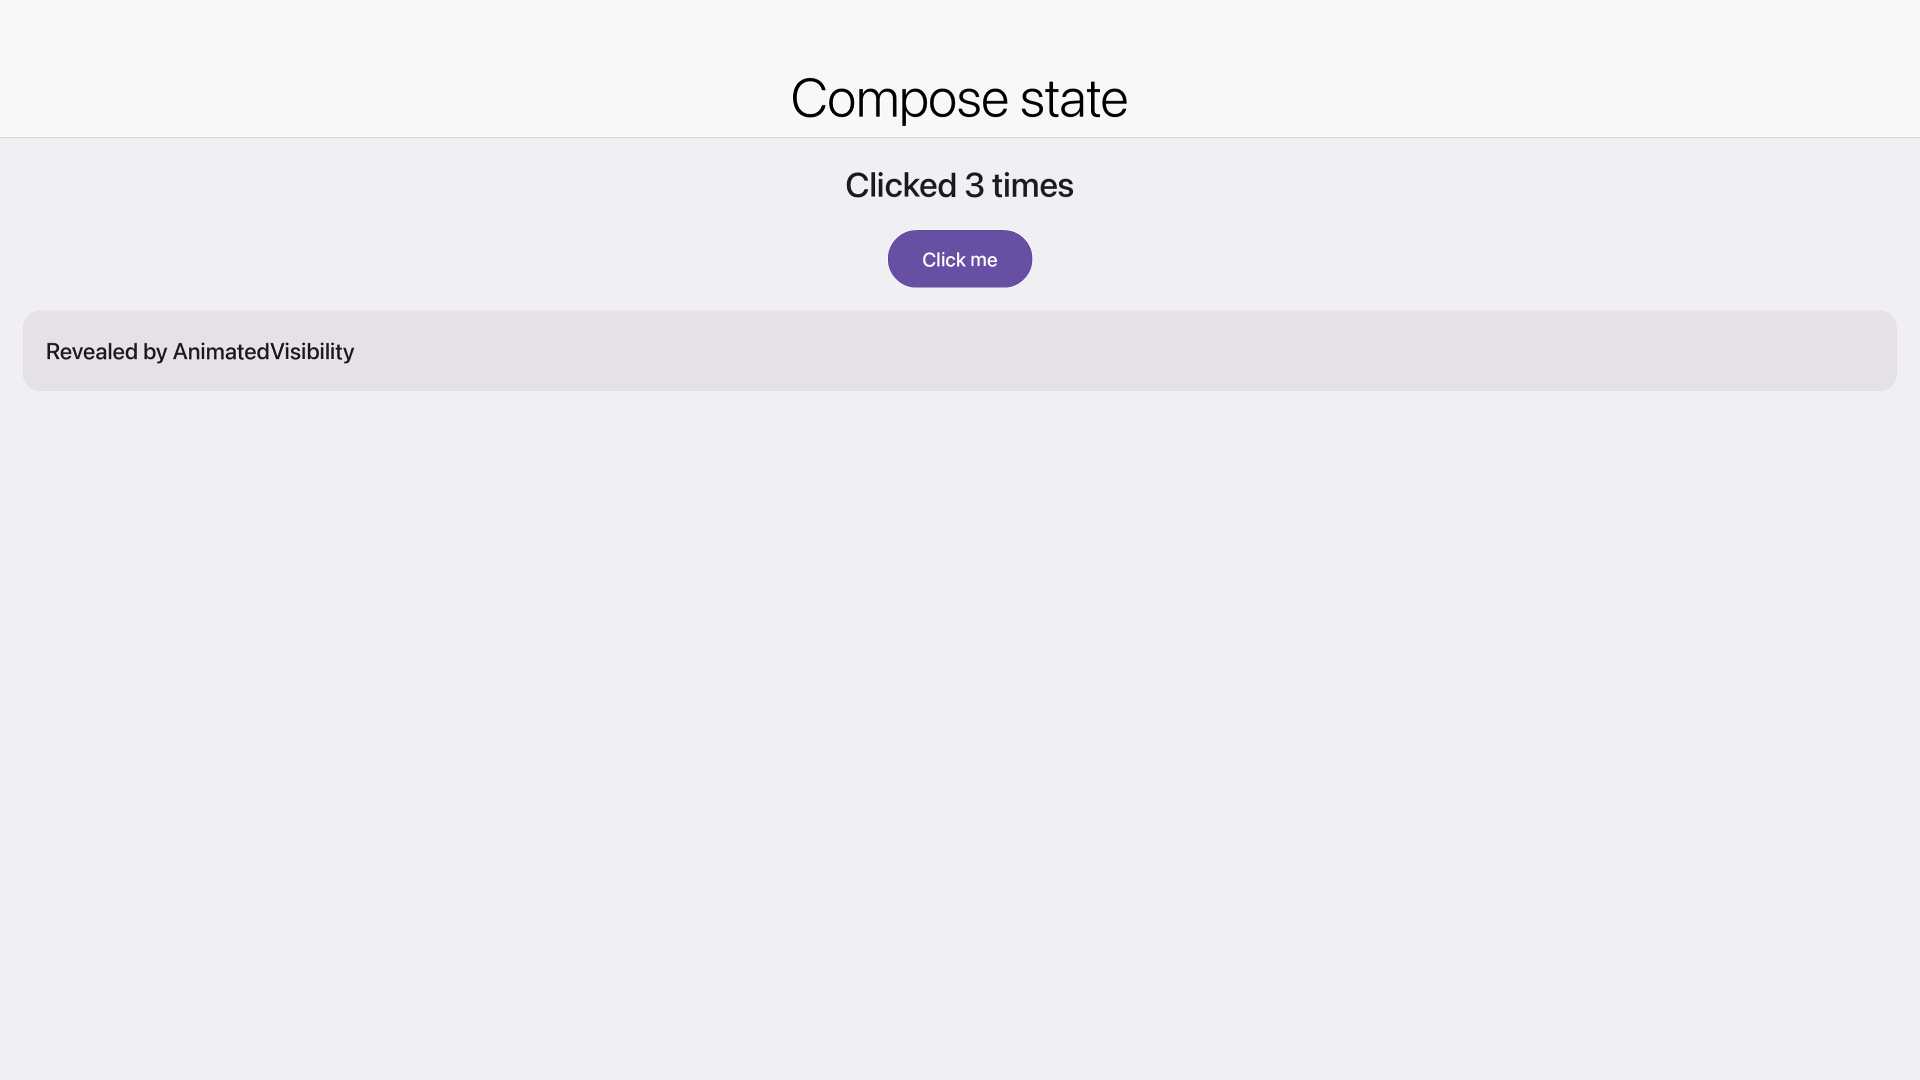
  • KmpCompatState — missing reference. Reference screenshot missing at /Users/runner/work/CodenameOne/CodenameOne/scripts/ios/screenshots-tv/KmpCompatState.png.

    KmpCompatState
    Preview info: JPEG preview quality 50; JPEG preview quality 50; downscaled to 1920x1080.
    Full-resolution PNG saved as KmpCompatState.png in workflow artifacts.

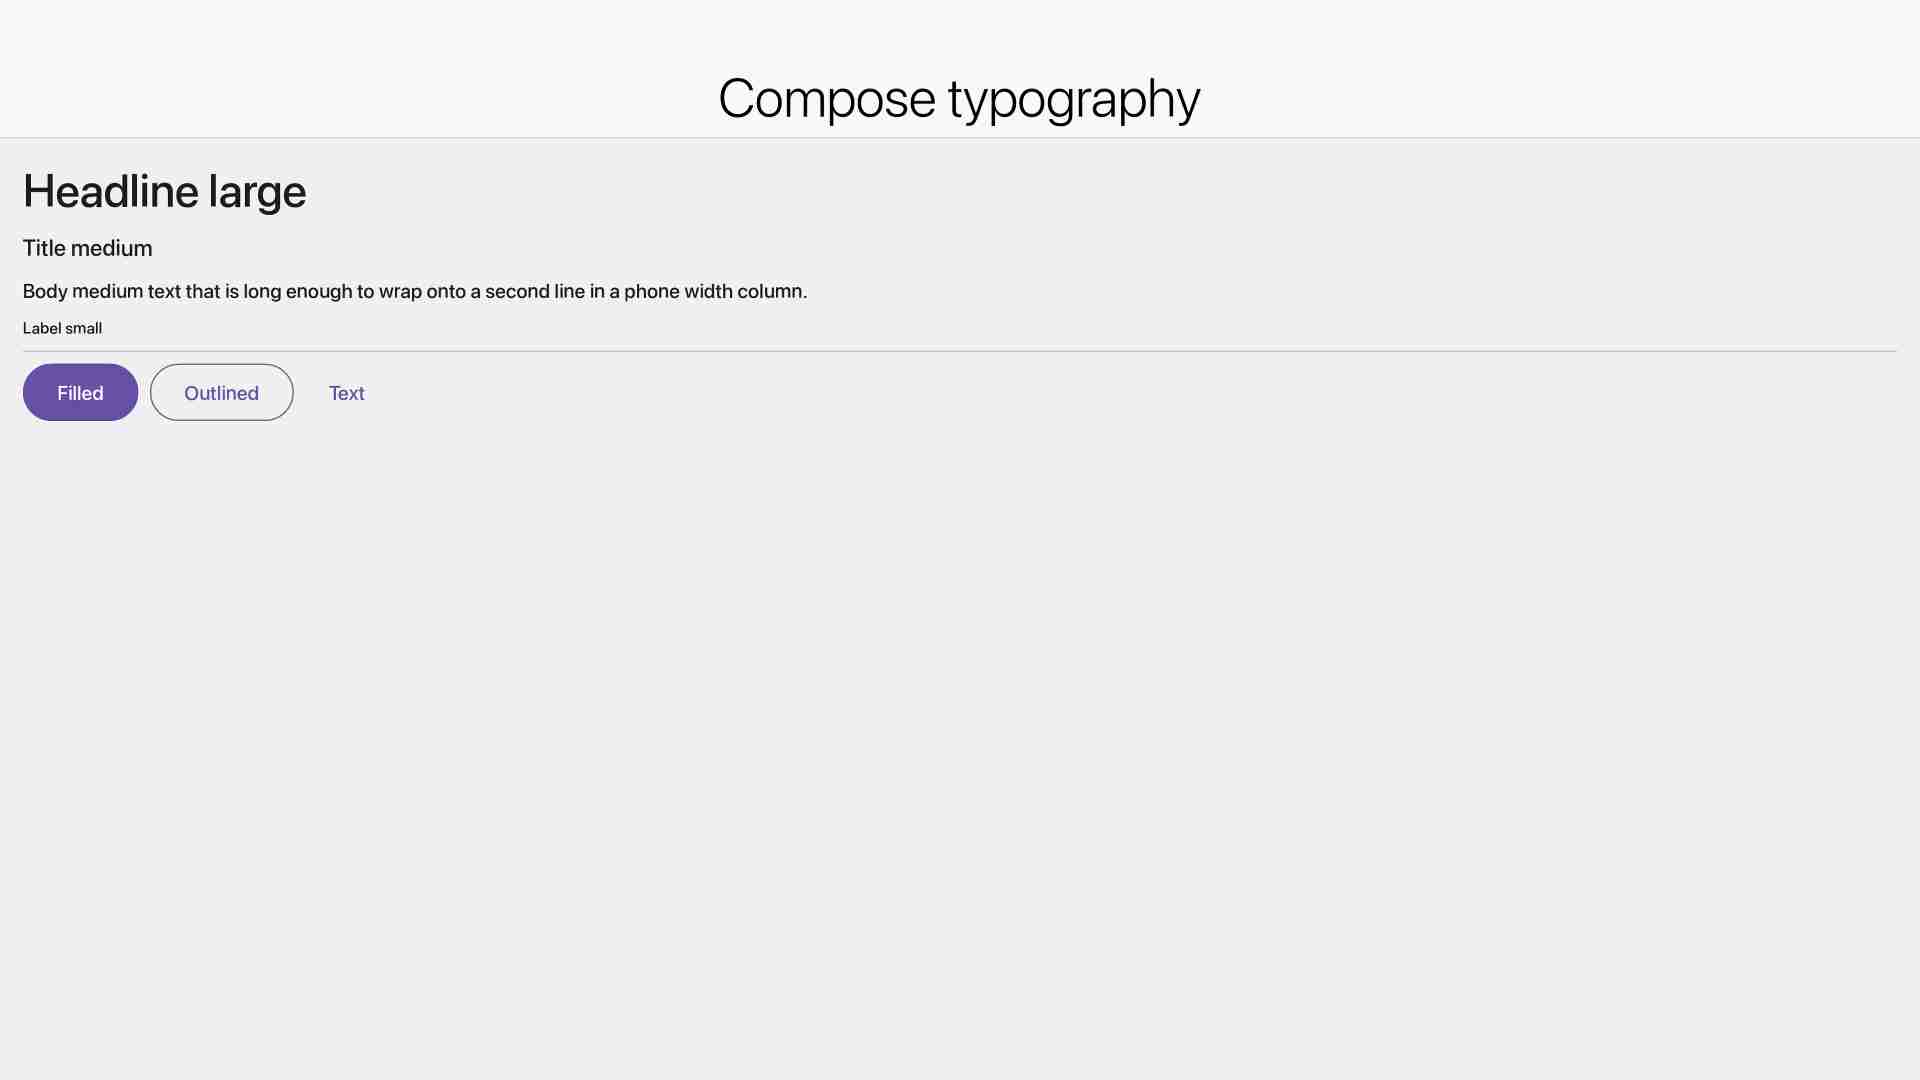
  • KmpCompatTypography — missing reference. Reference screenshot missing at /Users/runner/work/CodenameOne/CodenameOne/scripts/ios/screenshots-tv/KmpCompatTypography.png.

    KmpCompatTypography
    Preview info: JPEG preview quality 20; JPEG preview quality 20; downscaled to 1920x1080.
    Full-resolution PNG saved as KmpCompatTypography.png in workflow artifacts.

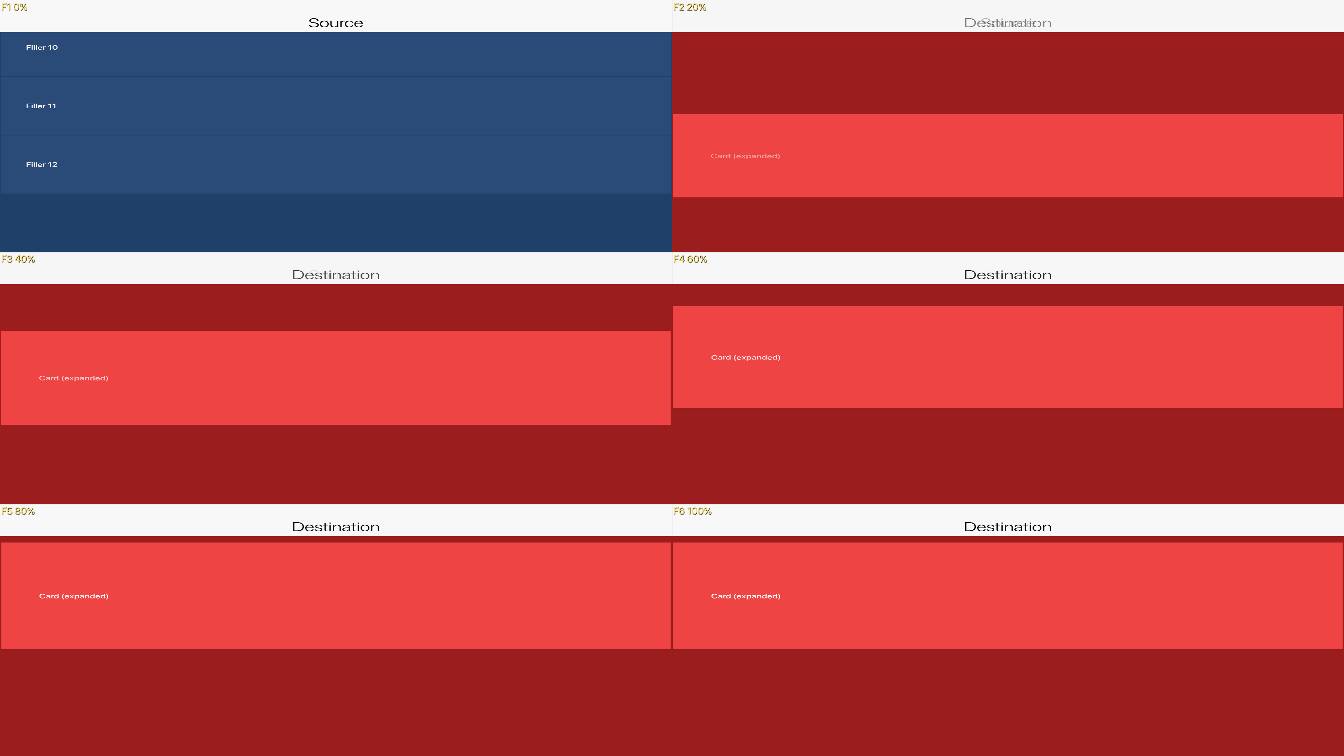
  • MorphTransitionScrolledSourceTest — updated screenshot. Screenshot differs (3840x2160 px, bit depth 8).

    MorphTransitionScrolledSourceTest
    Preview info: JPEG preview quality 70; JPEG preview quality 70; downscaled to 1344x756.
    Full-resolution PNG saved as MorphTransitionScrolledSourceTest.png in workflow artifacts.

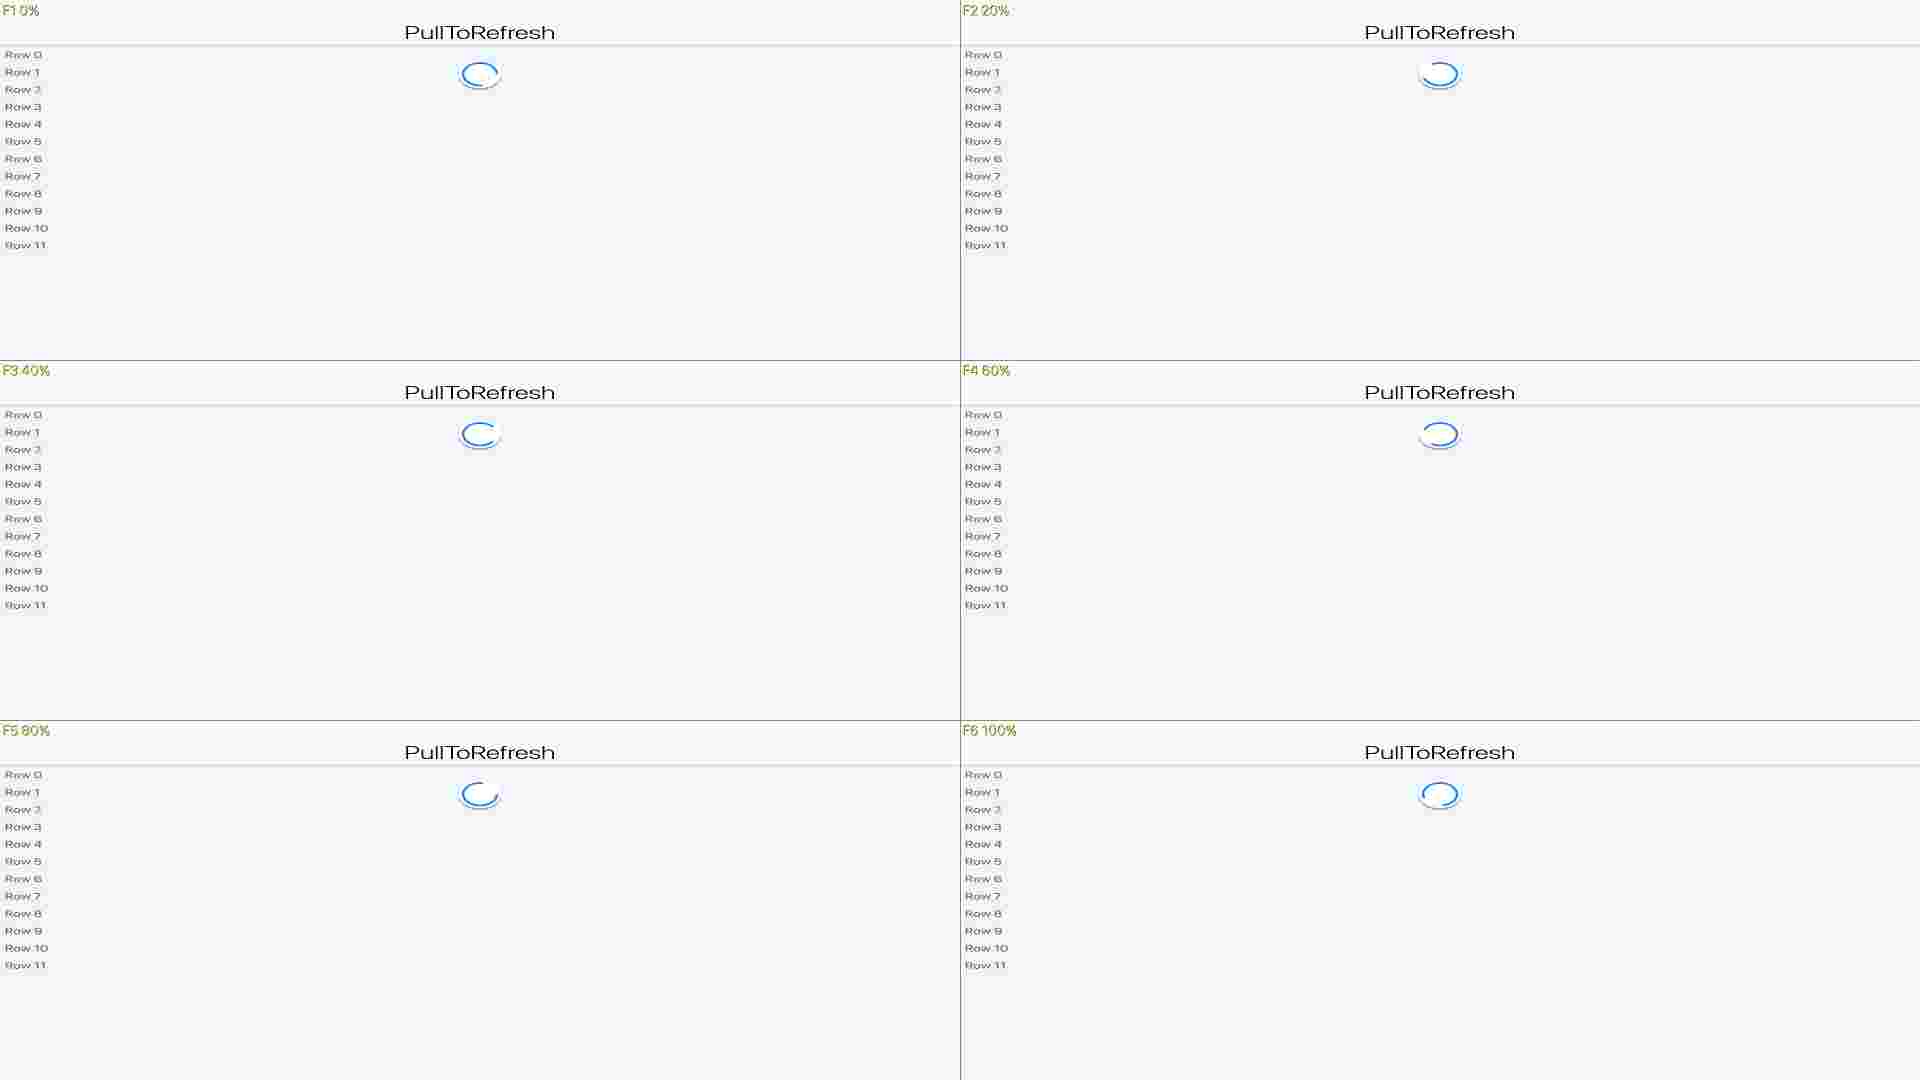
  • PullToRefreshSpinnerScreenshotTest — updated screenshot. Screenshot differs (3840x2160 px, bit depth 8).

    PullToRefreshSpinnerScreenshotTest
    Preview info: JPEG preview quality 10; JPEG preview quality 10; downscaled to 1920x1080.
    Full-resolution PNG saved as PullToRefreshSpinnerScreenshotTest.png in workflow artifacts.

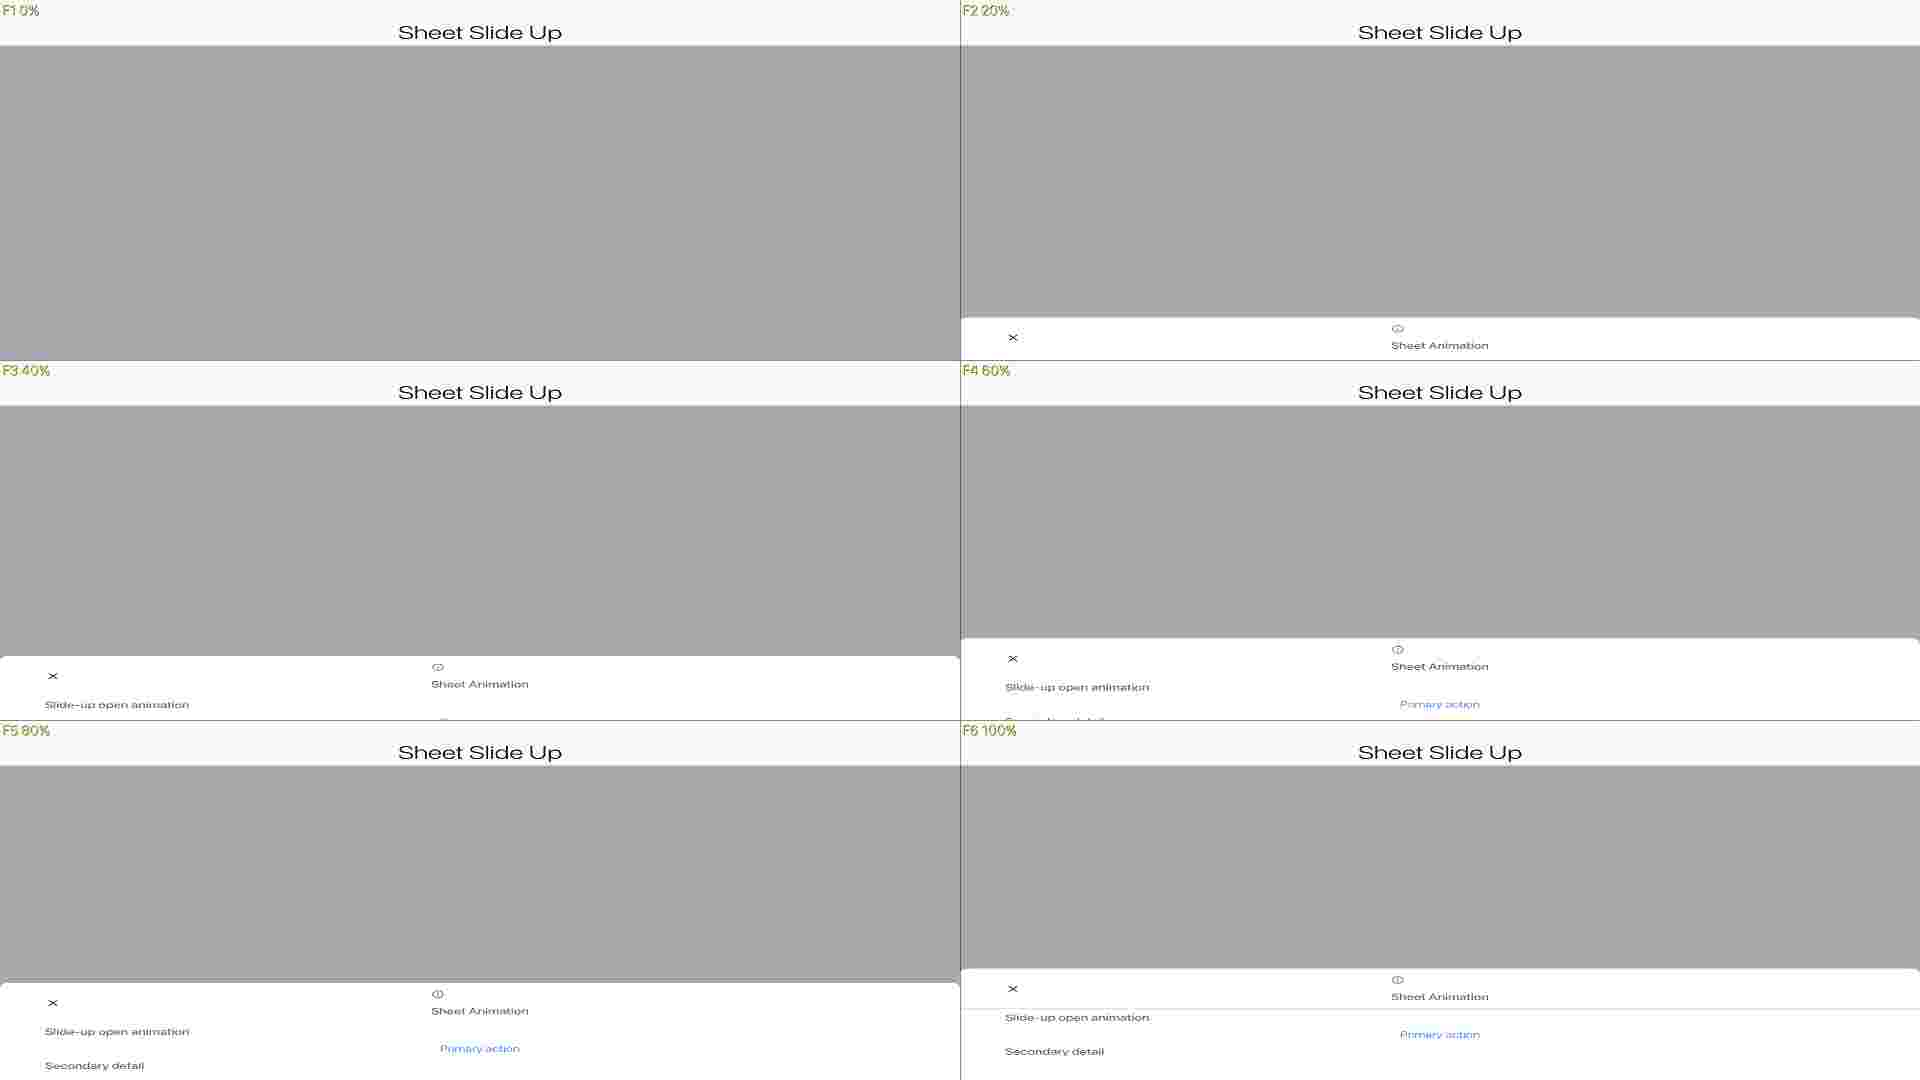
  • SheetSlideUpAnimationScreenshotTest — updated screenshot. Screenshot differs (3840x2160 px, bit depth 8).

    SheetSlideUpAnimationScreenshotTest
    Preview info: JPEG preview quality 10; JPEG preview quality 10; downscaled to 1920x1080.
    Full-resolution PNG saved as SheetSlideUpAnimationScreenshotTest.png in workflow artifacts.

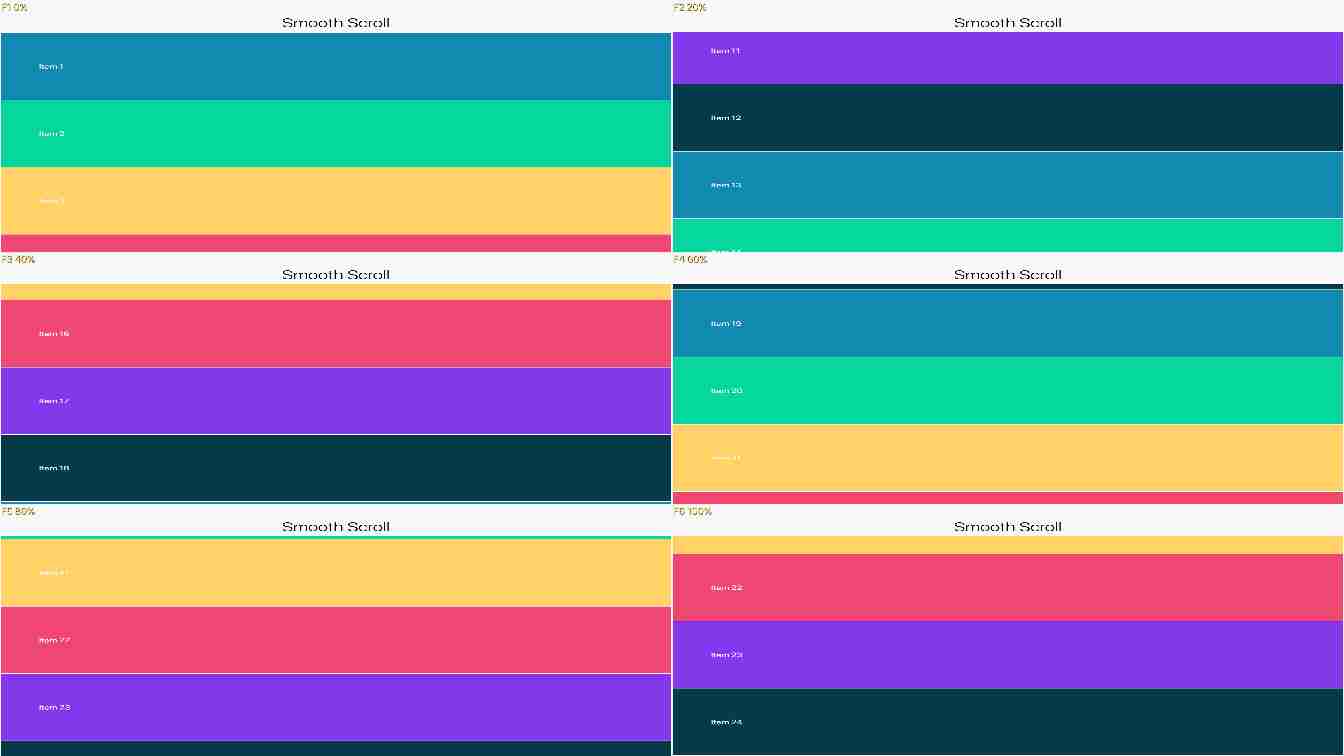
  • SmoothScrollScreenshotTest — updated screenshot. Screenshot differs (3840x2160 px, bit depth 8).

    SmoothScrollScreenshotTest
    Preview info: JPEG preview quality 20; JPEG preview quality 20; downscaled to 1344x756.
    Full-resolution PNG saved as SmoothScrollScreenshotTest.png in workflow artifacts.

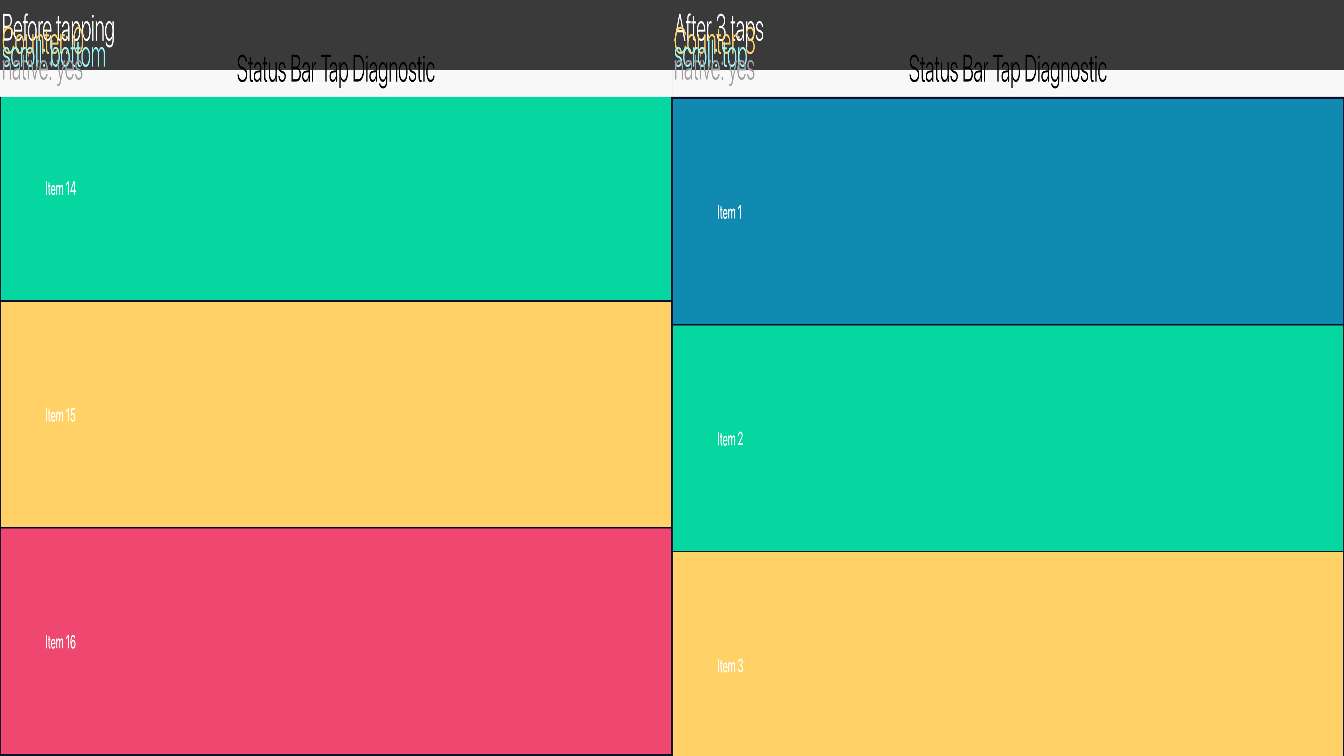
  • StatusBarTapDiagnosticScreenshotTest — updated screenshot. Screenshot differs (3840x2160 px, bit depth 8).

    StatusBarTapDiagnosticScreenshotTest
    Preview info: JPEG preview quality 60; JPEG preview quality 60; downscaled to 1344x756.
    Full-resolution PNG saved as StatusBarTapDiagnosticScreenshotTest.png in workflow artifacts.

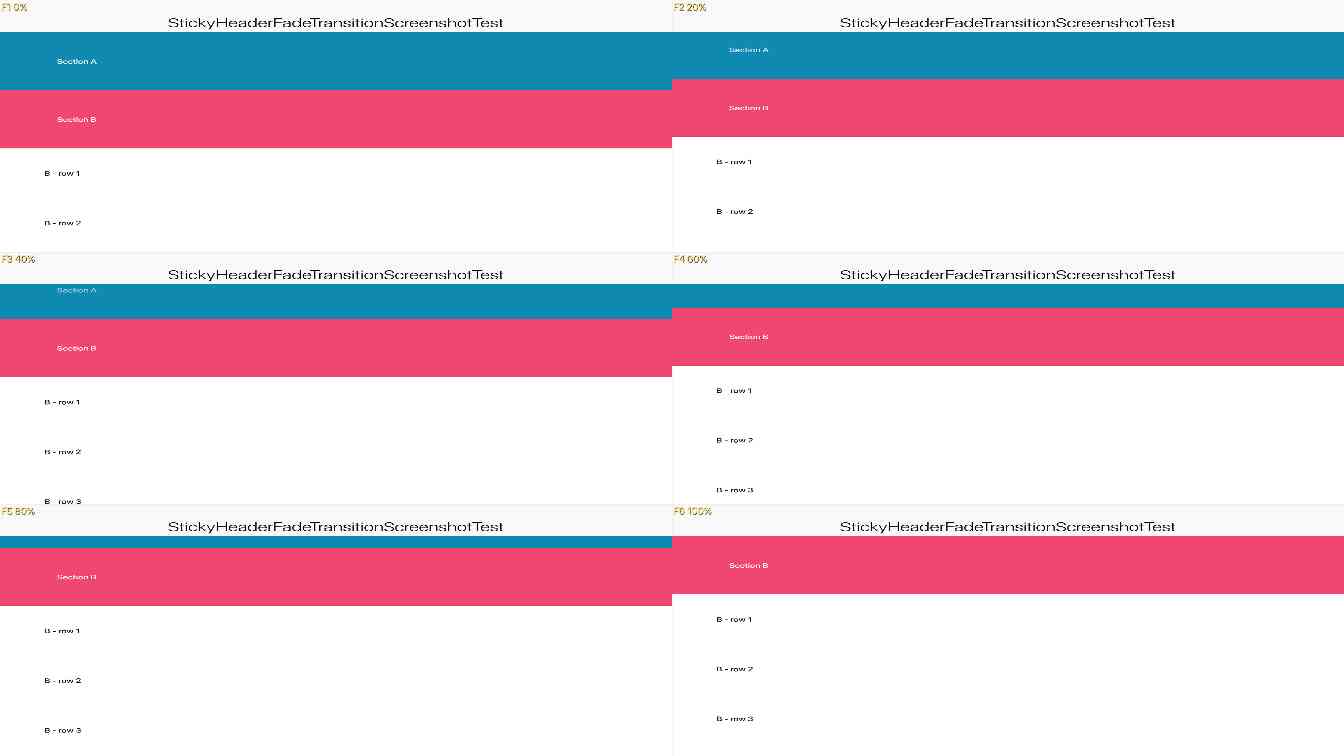
  • StickyHeaderFadeTransitionScreenshotTest — updated screenshot. Screenshot differs (3840x2160 px, bit depth 8).

    StickyHeaderFadeTransitionScreenshotTest
    Preview info: JPEG preview quality 30; JPEG preview quality 30; downscaled to 1344x756.
    Full-resolution PNG saved as StickyHeaderFadeTransitionScreenshotTest.png in workflow artifacts.

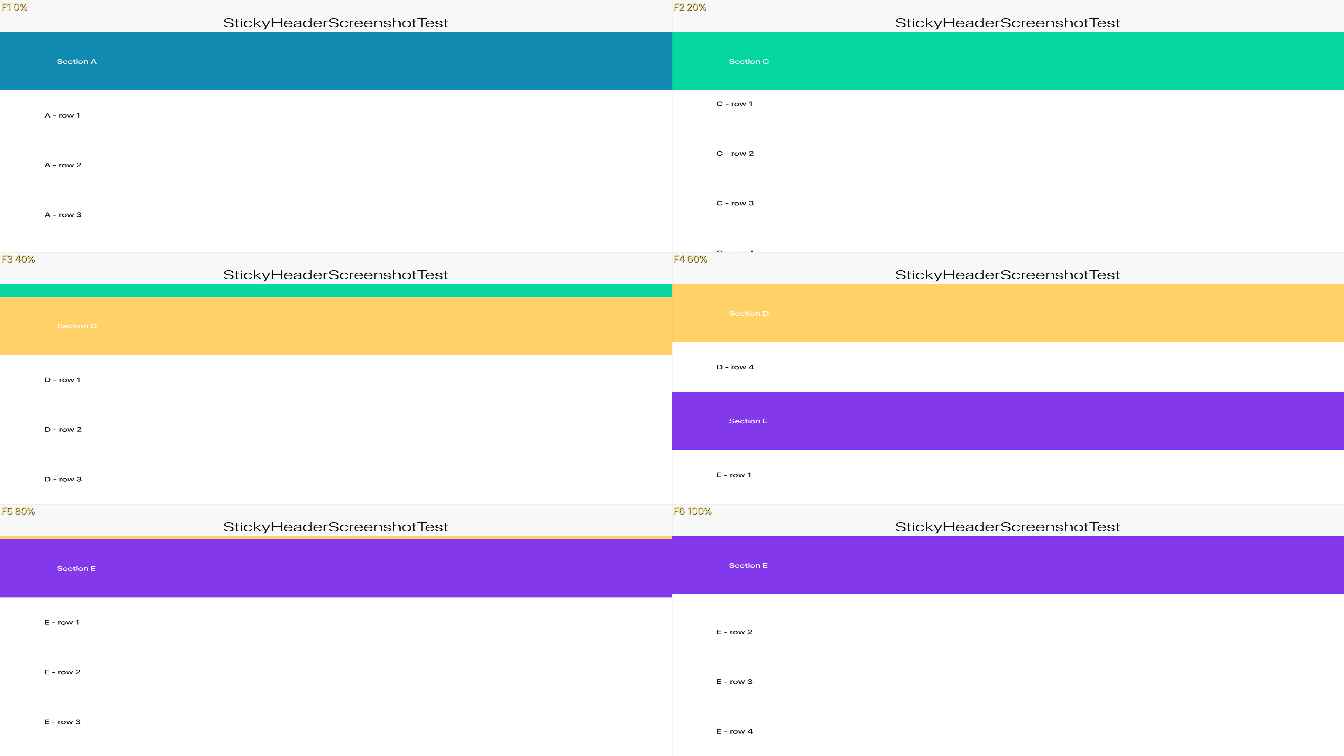
  • StickyHeaderScreenshotTest — updated screenshot. Screenshot differs (3840x2160 px, bit depth 8).

    StickyHeaderScreenshotTest
    Preview info: JPEG preview quality 40; JPEG preview quality 40; downscaled to 1344x756.
    Full-resolution PNG saved as StickyHeaderScreenshotTest.png in workflow artifacts.

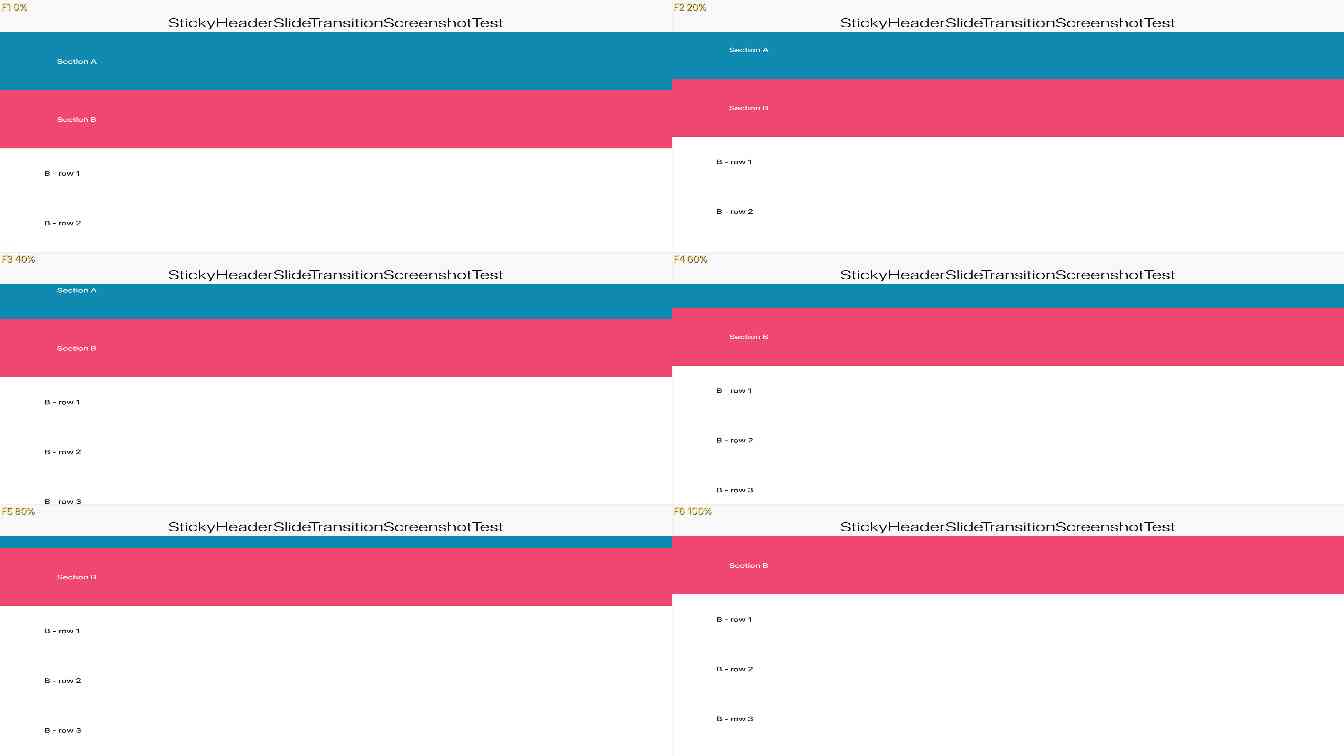
  • StickyHeaderSlideTransitionScreenshotTest — updated screenshot. Screenshot differs (3840x2160 px, bit depth 8).

    StickyHeaderSlideTransitionScreenshotTest
    Preview info: JPEG preview quality 30; JPEG preview quality 30; downscaled to 1344x756.
    Full-resolution PNG saved as StickyHeaderSlideTransitionScreenshotTest.png in workflow artifacts.

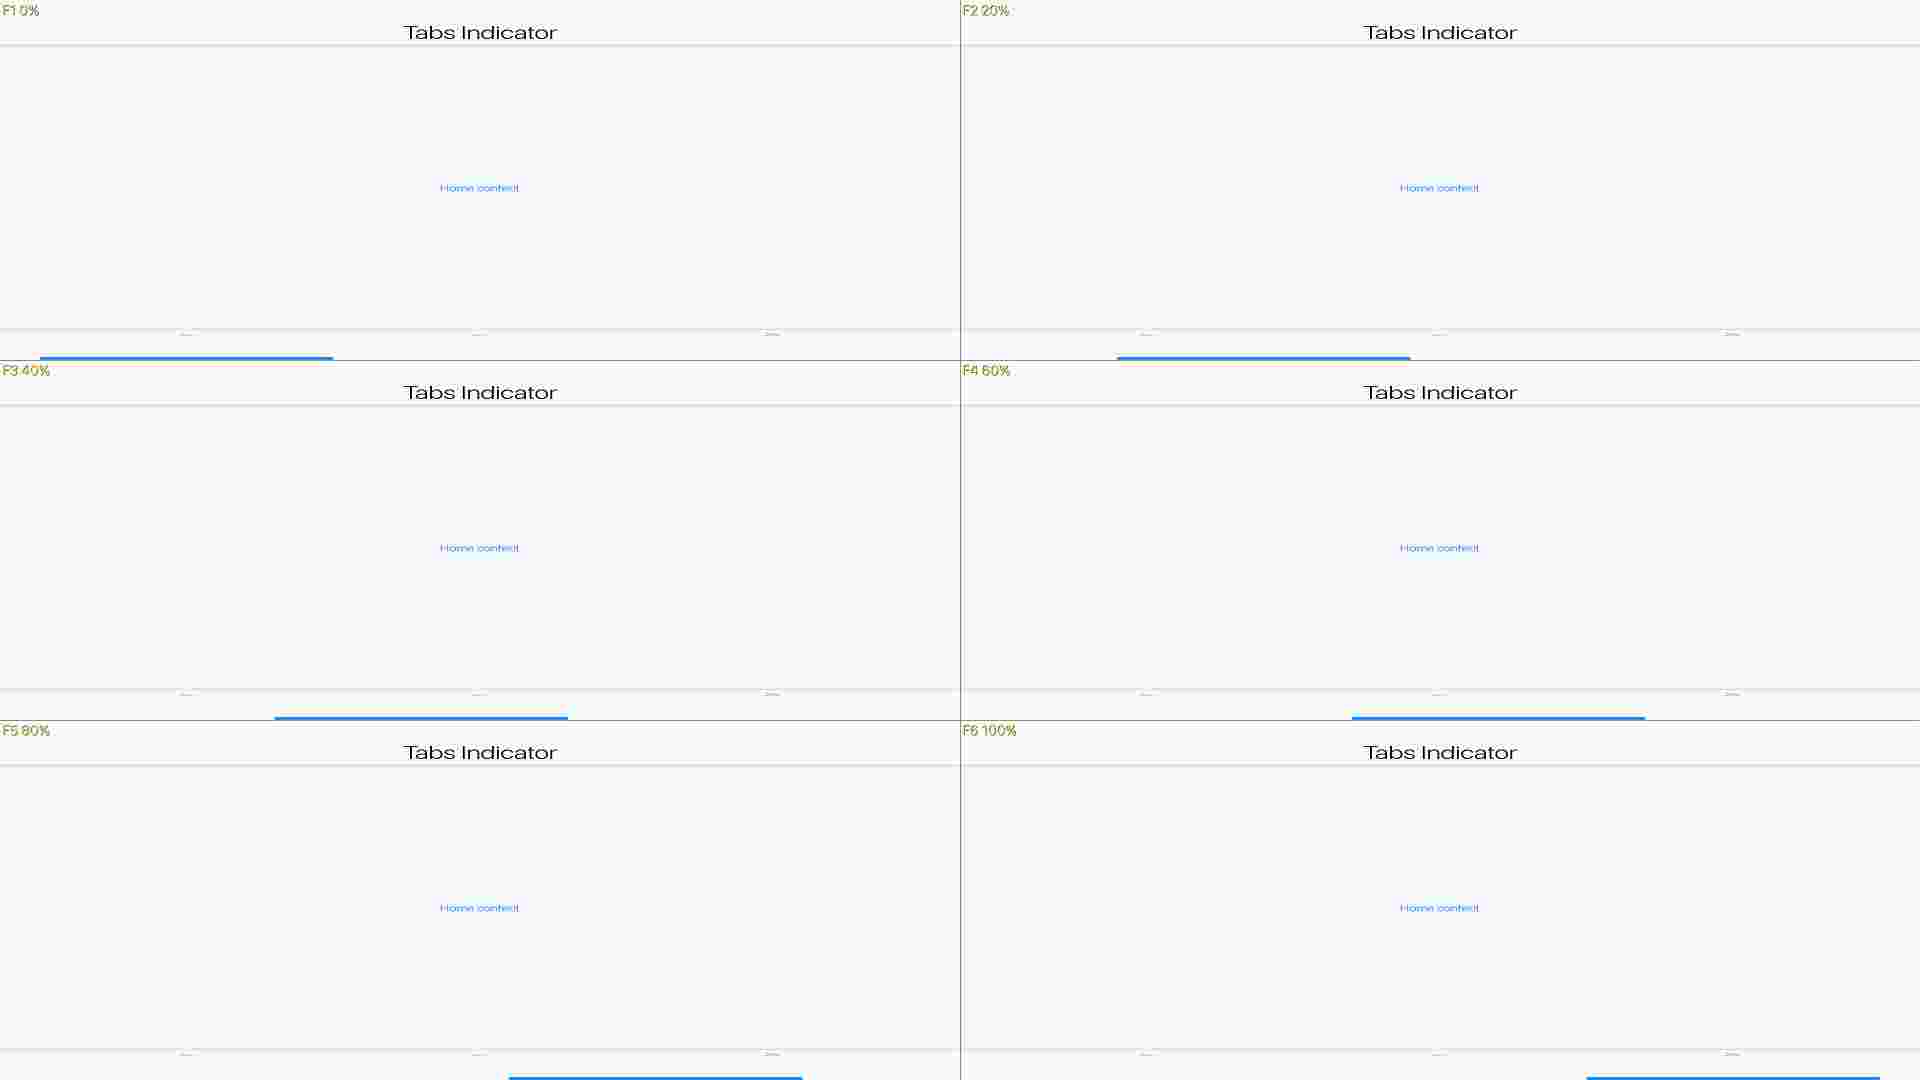
  • TabsAnimatedIndicatorScreenshotTest — updated screenshot. Screenshot differs (3840x2160 px, bit depth 8).

    TabsAnimatedIndicatorScreenshotTest
    Preview info: JPEG preview quality 10; JPEG preview quality 10; downscaled to 1920x1080.
    Full-resolution PNG saved as TabsAnimatedIndicatorScreenshotTest.png in workflow artifacts.

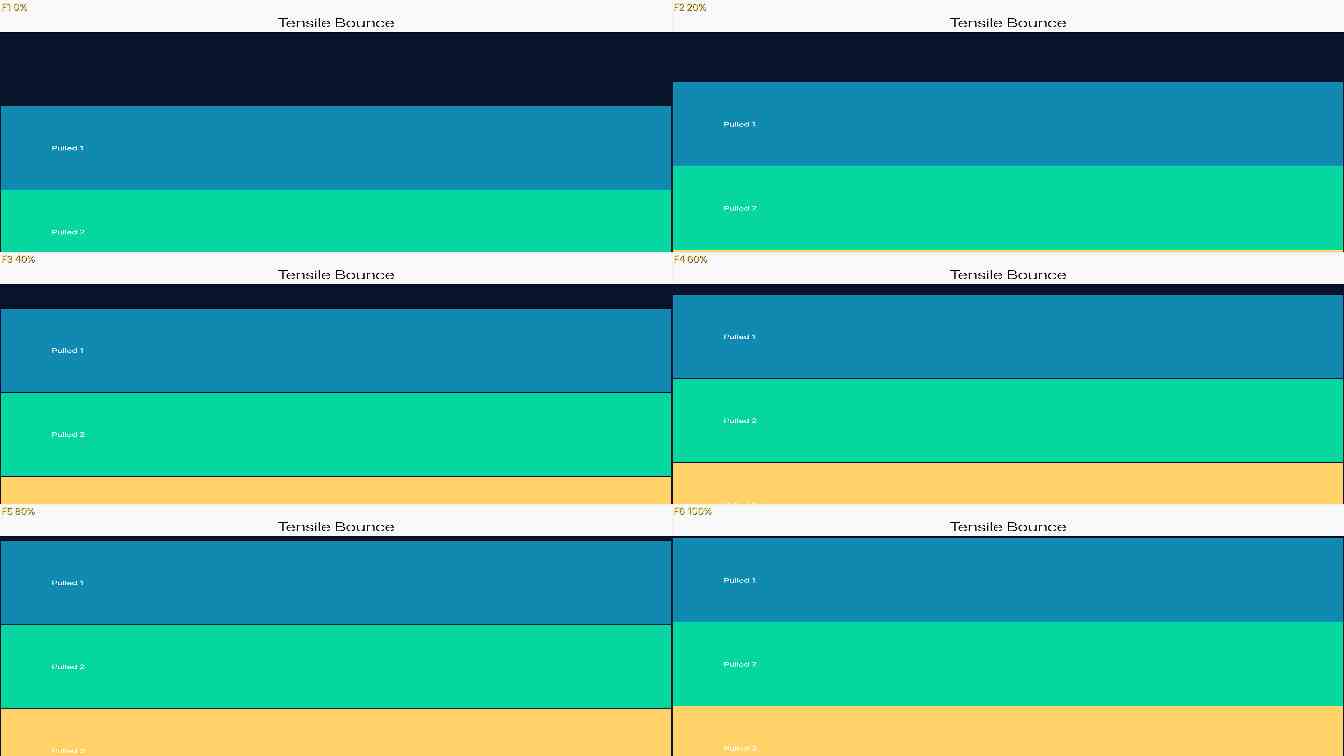
  • TensileBounceScreenshotTest — updated screenshot. Screenshot differs (3840x2160 px, bit depth 8).

    TensileBounceScreenshotTest
    Preview info: JPEG preview quality 30; JPEG preview quality 30; downscaled to 1344x756.
    Full-resolution PNG saved as TensileBounceScreenshotTest.png in workflow artifacts.

@shai-almog

Copy link
Copy Markdown
Collaborator Author

No description provided.

Sign up for free to join this conversation on GitHub. Already have an account? Sign in to comment

Labels

None yet

Projects

None yet

Development

Successfully merging this pull request may close these issues.

1 participant