
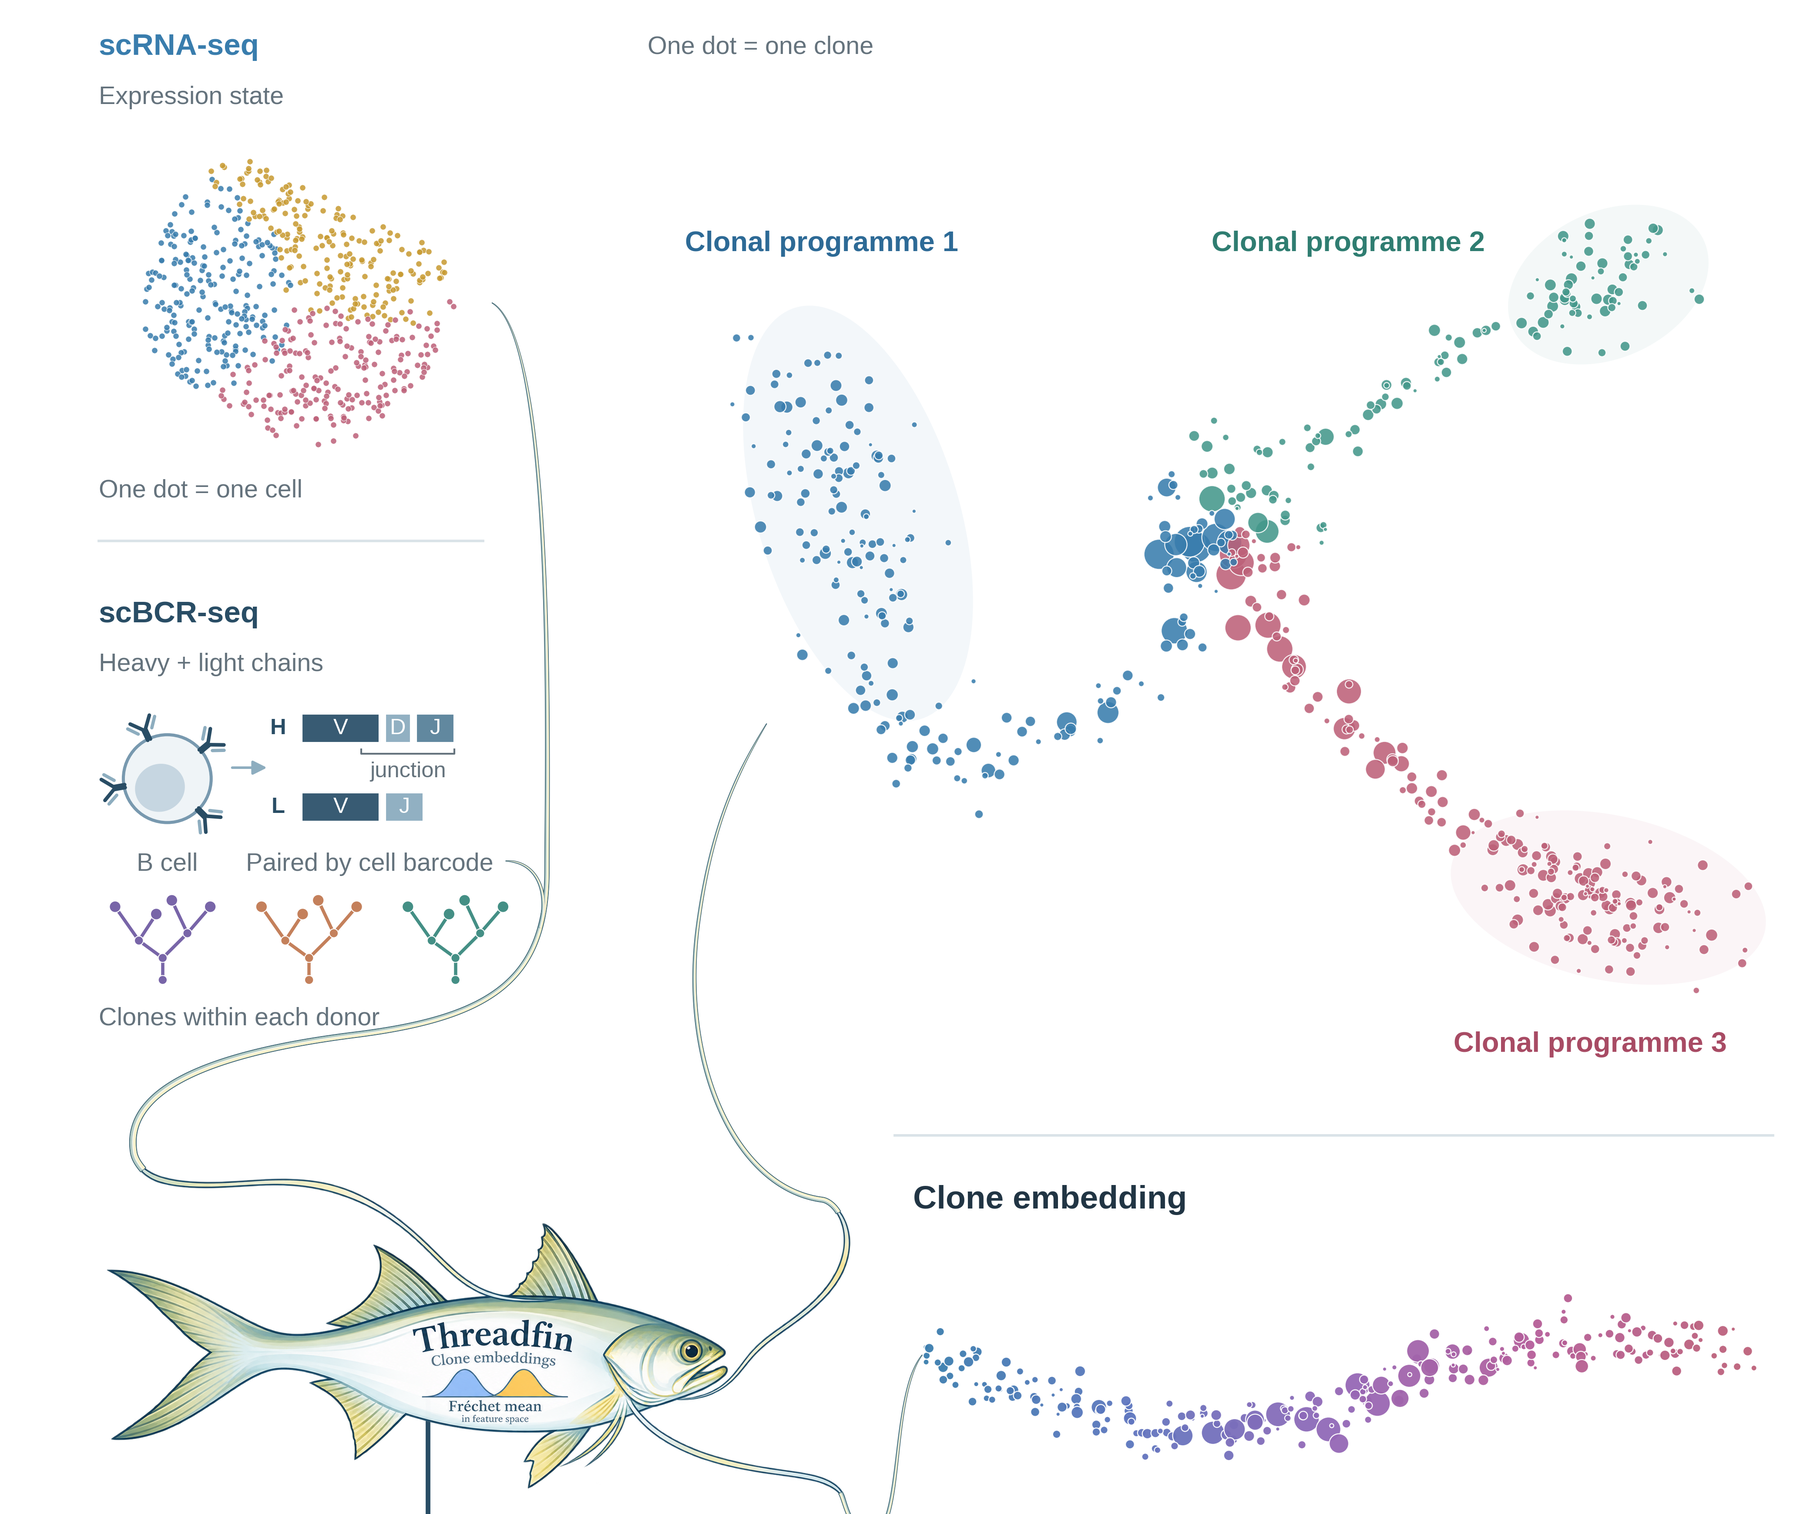
Relationships between B-cell clones from paired single-cell RNA and receptor sequencing


Threadfin takes paired single-cell RNA and receptor (BCR or TCR) sequencing and describes every clone by the distribution of its cells' transcriptional states, so that clones, not cells, can be compared, mapped and tested.
pip install threadfin                  # Python 3.10–3.14 on Linux, macOS or Windows; no GPU or R needed
pip install "threadfin[dandelion]"     # also installs Dandelion (0.5.x), to call clones from BCR or TCR contigs
Scanpy, Leiden, UMAP and Harmony are installed with it; a fresh pip install "threadfin[dandelion]" takes about
3 minutes. Clone calls are the same in every Python session, with no setting needed. Dandelion's clone calls
depend on Python's string-hash seed, so Threadfin always calls them under seed 0, in a separate Python process
when Python was not started with PYTHONHASHSEED=0 (about 2 s more). Threadfin is validated with Dandelion 0.5.x;
Dandelion 1.0 (October 2026) calls clones differently, so the extra installs sc-dandelion<1.
The development version installs with
pip install "git+https://github.com/Reynold4k/Threadfin.git".
You need, for the same cells: raw gene counts in an AnnData object, the
contig-level receptor table (Cell Ranger's filtered_contig_annotations.csv or an AIRR .tsv), and the donor
and sample of each cell.
import scanpy as sc
import threadfin as tf

adata = sc.read_h5ad("b_cells.h5ad")           # raw counts, one row per cell

result = tf.run(
    adata,
    bcr="filtered_contig_annotations.csv",     # Cell Ranger VDJ output or an AIRR .tsv
    donor_key="donor",                         # the individual each cell came from
    sample_key="sample",                       # the sample or library each cell came from (never a sort gate,
                                               # tissue or time point you want to compare: those go in test=)
    n_jobs=8,                                  # processes to use; the result is the same for any number
)
tf.run calls clones within each donor (Dandelion, paired chains), builds an expression embedding without the
receptor genes, estimates one profile per clone with two or more cells, tests clonal coherence, lays out the
clone map and looks for clonal programmes. On the 16 public datasets tested (884 to 206,000 cells) it took about 1
to 11 minutes with 8 cores (run time and memory).
print(result.summary())                 # plain-language report
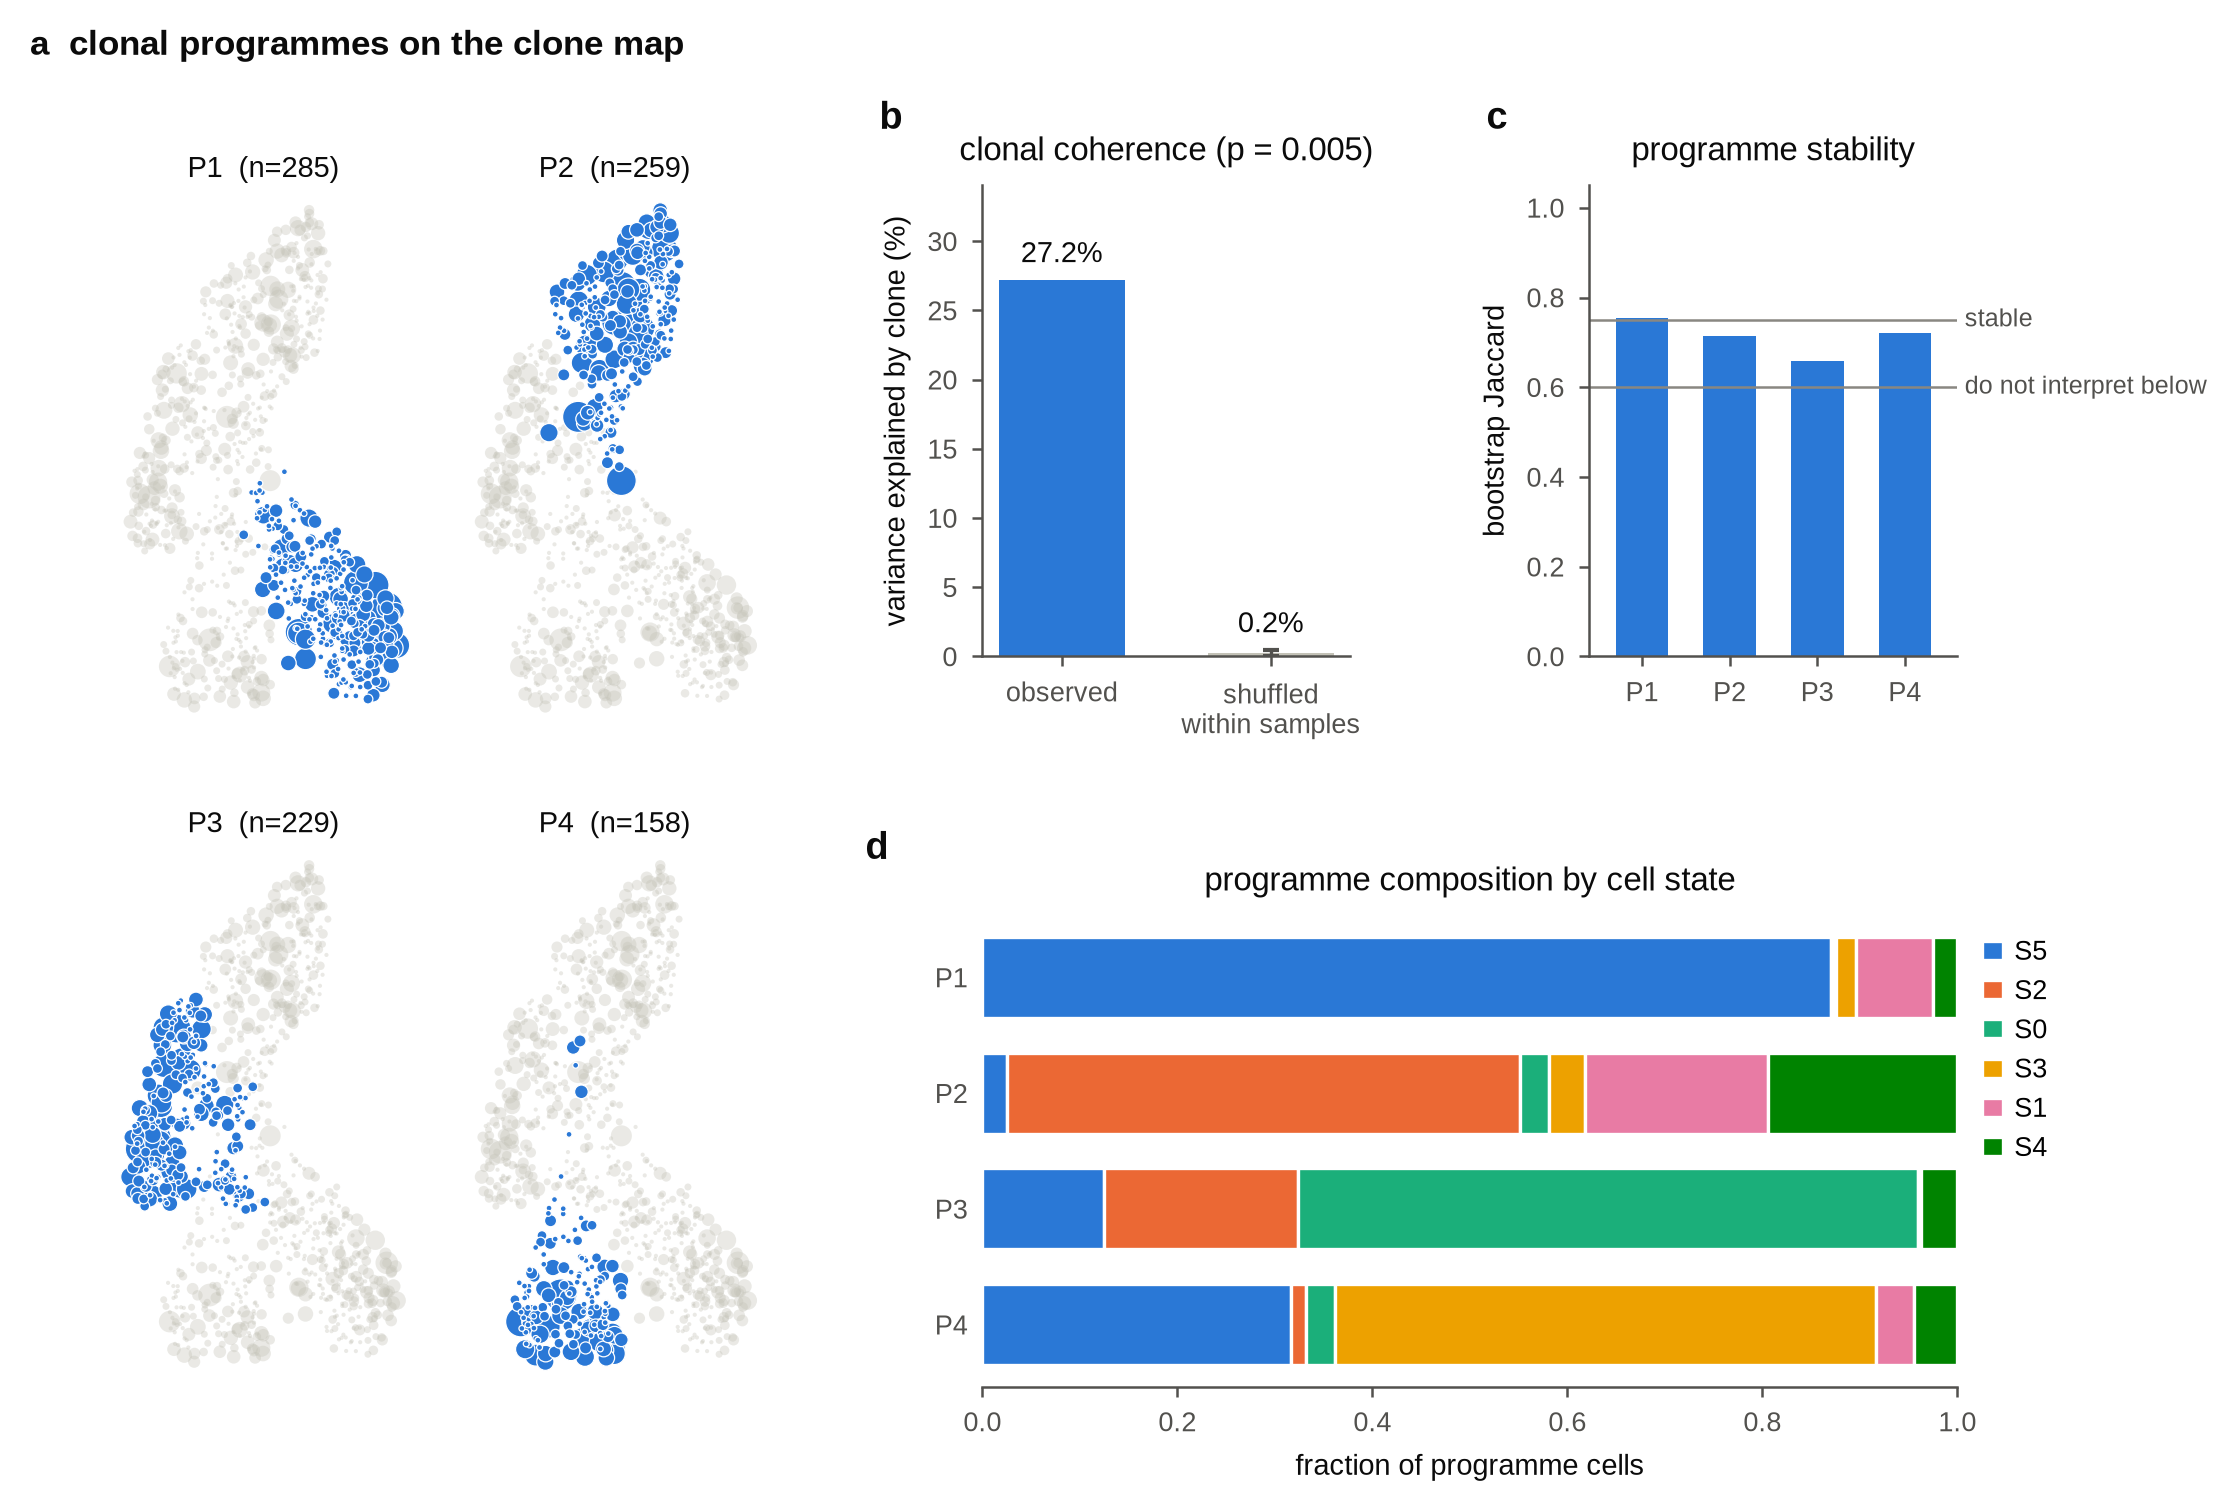
result.plot("threadfin_overview.pdf")   # clone map, coherence, stability, programme sizes or composition
print(result.methods())                 # a Methods paragraph with the settings and versions used
result.clones.to_csv("clones.csv")      # per clone with >= 2 cells: size, reliability, programme, map position
| What you get | Where |
|---|---|
| Are cells of one clone more alike than cells of different clones? Clonal coherence, its excess over shuffled clone labels and its permutation P value | result.coherence; first part of the summary |
| A map with one point per clone | result.plot(); result.clones[["x", "y"]] |
| Groups of clones that behave alike (programmes), with their stability and state composition | result.programmes; result.composition; adata.obs["clone_programme"] |
| How much your own labels explain the differences between clones | result.profile_tests (with test=[...]) |
| A Methods paragraph for your paper, with references | result.methods() |
- Your own labels (antigen binding, isotype, sort gate): any
adata.obscolumns, e.g.tf.run(..., test=["antigen_binding", "isotype"]). - Several tissues or sort gates per donor, each sequenced in its own libraries: describe clones relative to the
donor, so that differences between tissues are kept, and shuffle clone labels within libraries,
tf.run(..., sample_key="donor", strata_key="sample")(Tutorial 2, section 5). - Time points or tissues, to ask whether clones keep their state:
tf.run(..., time_key="timepoint"). - Programmes described per clone: with
state_key=, the state composition of each programme is the share of its cells in each state;composition_weight="clones"counts every clone once instead. - T cells: pass the TCR contigs as
bcr; clones are called on identical beta and alpha junctions. - scirpy users: pass your scirpy AnnData or MuData as
bcr. - Clones defined elsewhere: put them in
adata.obs["clone_id"]and leave outbcr. - Large data:
n_jobs=-1uses every CPU core (run time and memory). - Identical results:
n_jobsnever changes a result. The automatically chosen clone map can change with the number of BLAS threads, so keepOMP_NUM_THREADSthe same between runs; every statistic agrees to about 1e-7 either way. Random draws follow the order of the cells, so the same cells in another order can give different programmes; sort them first (adata = adata[adata.obs_names.sort_values()].copy()) when results must not depend on the order. - No data at hand:
adata = tf.sim.simulate_repertoire()makes a repertoire with a known answer; it already has clone ids and an embedding, so run it withtf.run(adata, donor_key="donor", sample_key="context", basis="X_pca")(tutorial 1).
The complete tf.run, from raw counts and contigs to the summary, on subsamples of a real dataset (EBV tonsil
organoids, GSE317492) with 8 cores:
| Cells | Time | Extra peak memory |
|---|---|---|
| 25,000 | 100 s | 2.3 GB |
| 50,000 | 160 s | 4.7 GB |
| 100,000 | 329 s | 9.2 GB |
| 205,630 | 650 s | 18.6 GB |
Time grows about linearly with the number of cells. Clone calling with Dandelion is the longest step (45 % of the run at full size). The extra peak memory comes on top of the loaded data, about 0.09 GB per 1,000 cells, and is set by building the expression embedding. With a precomputed embedding and given clone ids, the remaining steps take about an hour for a million simulated cells on 8 cores (scalability).
| Tutorial | What it covers |
|---|---|
| 1 — Getting started | the whole analysis on simulated data in a minute, with every output explained |
| 2 — Your own data | from Cell Ranger output to results: quality control, several samples and donors, clone calling, T cells, troubleshooting |
| 3 — The clone map | automatic and hand-set layouts, and how to check a map |
| 4 — Step by step | the individual functions in threadfin.tl |
| 5 — From GEO to results (notebook) | a published dataset (GSE287123) end to end: download, hashtag demultiplexing, clones, embedding, Threadfin and interpretation; executed in a fresh environment before every release (about 6 minutes on 8 cores) |
New in 4.6.0: strata_key= names the sampling unit within which the coherence test shuffles clone labels when it
is finer than the context (sample_key); composition_weight="clones" describes each programme by its average
clone; the summary states the excess of clonal coherence over shuffled labels, the strata used and the order of
time points or tissues. Clone calls are identical in every session, with no setting. The Dandelion extra installs
on Python 3.10–3.14. Clonal memory compares a clone with other clones of its donor seen at the same two levels,
with each snapshot's own noise. The gene-set test allows for co-expressed genes. Export-lag intervals hold for
any distribution, also in days. Label tests shuffle among clones of the same donor and of similar size, and flag
labels fixed within each sample. The run is recorded in the AnnData, and ThreadfinResult.from_adata rebuilds
the result after saving.
4.5.3 keeps pynndescent below 0.7; 4.5.2 lists labels that are fixed within each donor
(age, sex) as not testable instead of reporting p = 1, and reads raw counts from a layer (counts_layer=); 4.5.1
pins Dandelion below 1.0. New in 4.5.0: T cells, scirpy input, result.methods() and gene-level summaries of the
clone landscape (changelog).
Threadfin is a Python package for paired single-cell RNA and B-cell receptor (BCR) sequencing. It uses the clone — the B cells that descend from one V(D)J rearrangement — as the unit of analysis. Each clone is represented by the distribution of transcriptional states among its sampled cells, estimated relative to the cells sampled alongside it and shrunk according to the number of cells captured. Clones are then compared with one another: in a clone embedding with one point per clone, in clonal programmes of clones that behave alike, and in clone-level tests of anything you measured. Threadfin works with AnnData and Scanpy, and defines clones with Dandelion.
The cells of one clone are distributed across states: germinal-centre (GC) B cells, plasmablasts, plasma cells and memory B cells. Two clones can have the same average state and still differ in how their cells are distributed. Selection, antigen affinity and fate bias act on clones, so questions such as which clones connect the germinal centre with antibody-secreting cells (ASCs) or does antigen binding go with a clone's state need the clone as the unit of representation and of statistical inference. Three features of repertoires sampled in vivo make this difficult, and Threadfin addresses each:
- Most clones are captured as one or a few cells. Profiles are shrunk according to the number of cells sampled, and every clone with two or more cells carries a reliability score: none is discarded for being small.
- Clone membership is confounded with donor, sample, tissue and sorting gate. Each clone is described relative to the cells sampled with it, and every permutation test shuffles labels only within the units of the sampling design: clone labels within libraries, the labels you test within donors.
- Treating cells as independent inflates significance. Label tests use clones, not cells, as replicates, and the coherence test compares real clones with random clones of the same sizes.
| Question | Output | Function |
|---|---|---|
| Are cells of one clone more alike than cells of different clones? | clonal coherence: the share of the variance of cell states explained by clone, against clone labels shuffled within sampling units | tl.clonal_coherence |
| How similar are clones to one another? | the clone embedding, laid out automatically so that it is no more fragmented than the clone profiles | tl.embed_clones |
| Which clones behave alike? | clonal programmes, with split tests and bootstrap stability | tl.find_programmes |
| What explains the differences between clones? | variance in clone profiles explained by a label; per-programme effects | tl.profile_association, tl.association_test |
| Do clones keep their state over time or across tissues? | the clonal memory index | tl.clonal_memory |
| How much less mutated is a clone's output than its own germinal-centre cells? | the median within-clone mutation gap with a sign-test interval; with a time column, also in days at the germinal centre's rate, with an interval | tl.export_lag |
The manuscript applies Threadfin to nine paired datasets from immunization, infection, vaccination and
spontaneous germinal centres (figures); scripts and results for these and
further public datasets are in case studies, and everything behind the
manuscript — status, datasets, every analysis and a benchmark against related tools — is in
manuscript/.
- Gut-associated lymphoid tissues (Siniscalco et al., Immunity 2025): the clone embedding orders the clones from GC B-cell clones, through clones that contain both GC B cells and ASCs, to ASC clones; clones whose ASCs lack GC-fate labelling group at the ASC end, and the isotype measured in the BCR sequences changes along the order (IgG1 to IgA).
- Spontaneous germinal centres (Castrillon et al., eLife 2023): position along the clone embedding orders clones by the diversity of their cell states, and memory-containing clones concentrate at one end.
- Plasmodium infection (Skinner et al., Nat. Immunol. 2026): whether plasmablasts were sampled together with GC B cells of the same clone is a property of clones that cannot be read from the cell-level embedding.
- Model-antigen germinal centres (Merkenschlager et al., Nature 2025): the main axis of variation between clone profiles follows recent division in two cohorts whose sequencing libraries are crossed; a library effect would push the two cohorts in opposite directions, and their division directions agree (cosine similarity 0.89). Antigen-bait and dark-zone gates are also associated with clone profiles but were each sequenced in their own library.
UMAP draws connected populations of clones as one picture only for suitable settings, and the suitable settings differ between datasets. Threadfin therefore chooses them for each dataset by default: it lays the clones out over a ladder of settings, scores each layout for coherence (the fraction of clones in one connected piece) and for fidelity to the clone profiles, and keeps the most faithful setting that holds together in every layout it tried. A map is not allowed to be more fragmented than the clone profiles themselves, and the final map is checked once more before it is returned. The record of the choice is stored with the results, and the settings can always be fixed by hand (Tutorial 3). Because the layout is chosen to stay connected, a connected map is not evidence of a continuum: whether clones form groups is judged from the programmes, their stability and the tests, which use the profiles.
tf.tl.embed_clones(adata)                               # automatic (default)
tf.tl.embed_clones(adata, n_neighbors=30, min_dist=0.3) # by hand
tf.tl.map_quality(features, xy)                         # score any clone map (profiles, coordinates)
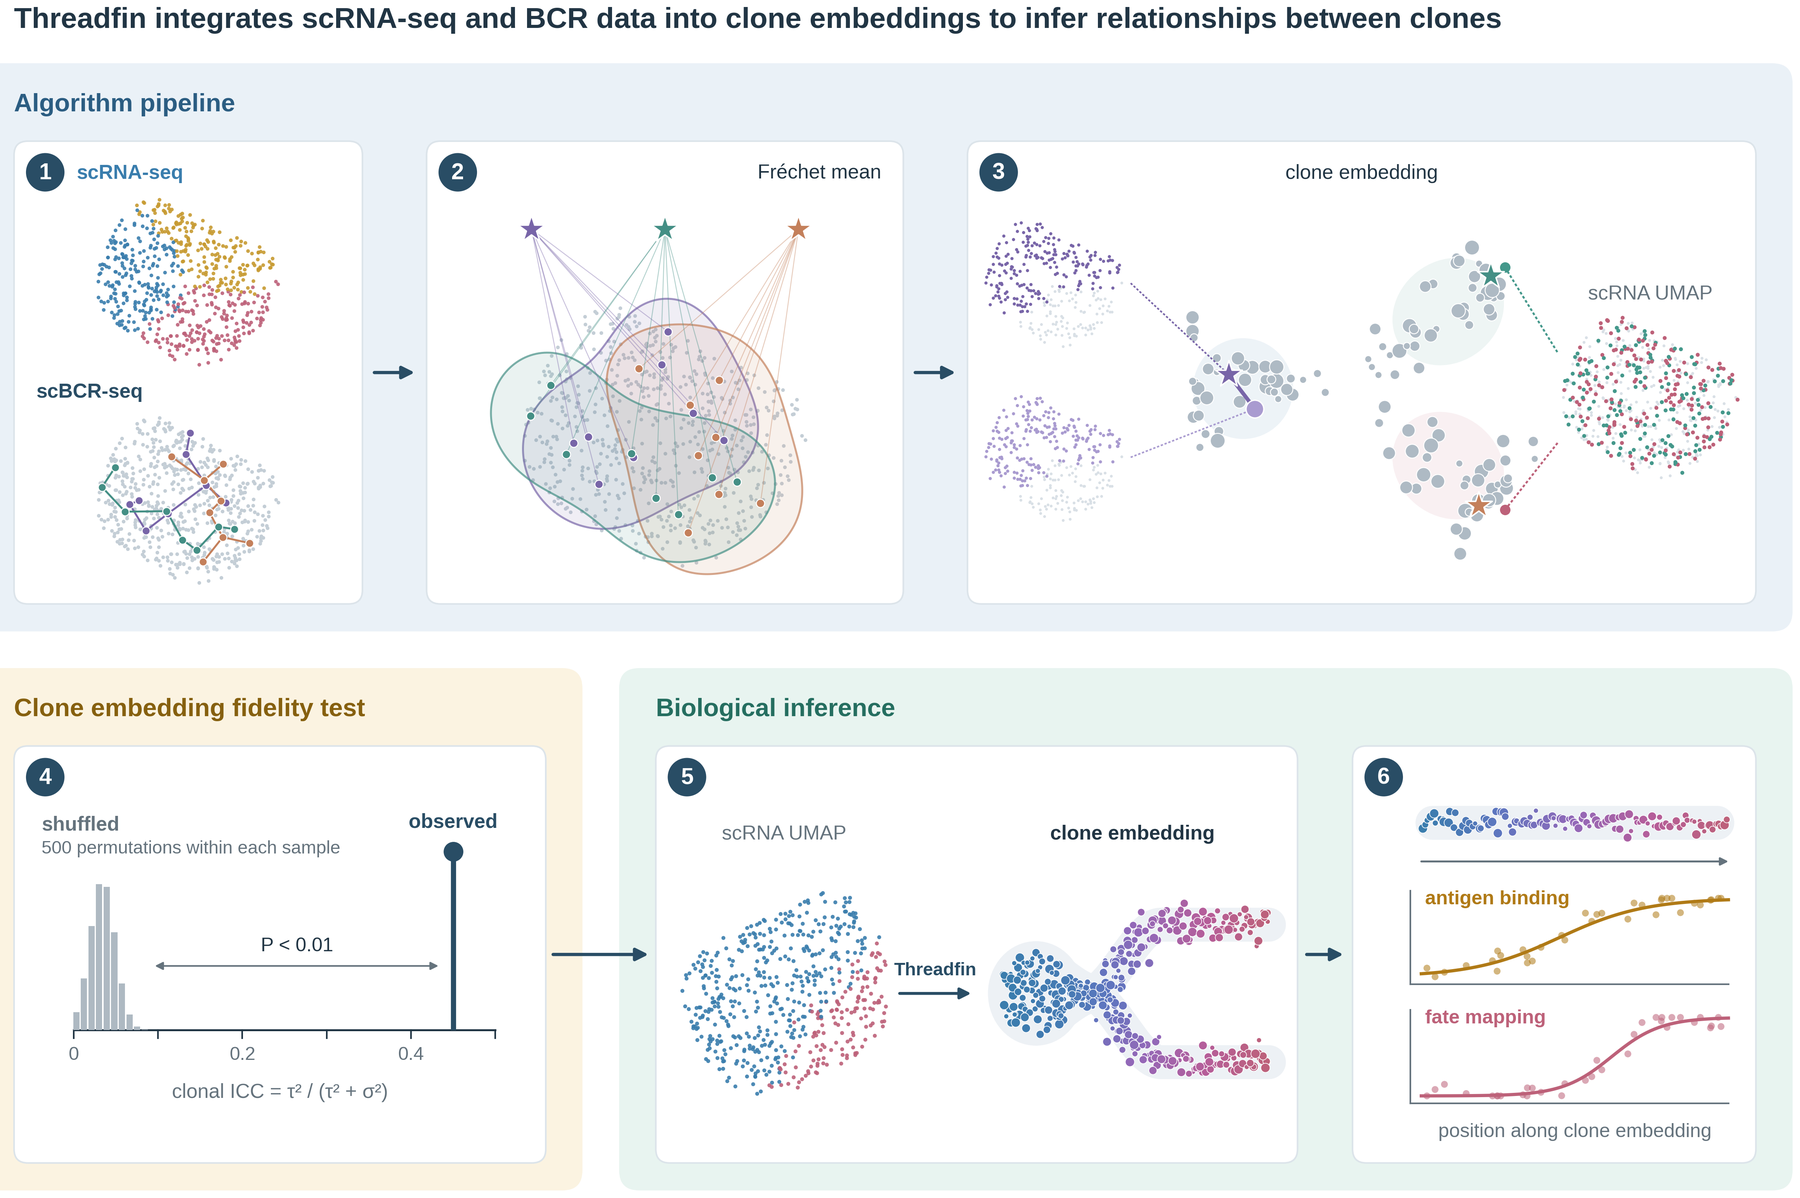
- Clones are defined from paired heavy- and light-chain sequences (for T cells, beta and alpha chains) within each donor (Dandelion).
- Clone profiles. Each cell is described relative to the mean of its sampling context. The cells of a clone are summarised by a kernel mean embedding of their state distribution, so a clone divided between two states differs from a clone in an intermediate state, and the profile is shrunk towards the average profile of all profiled clones according to the number of cells (best linear unbiased prediction under a random-effects model).
- Clonal coherence is the intraclass correlation of cell states (the expression embedding) within clones,
tested against clone labels permuted within sampling units (
strata_key; by default the sampling context). - The clone embedding is a UMAP of the clone profiles with settings chosen as above.
- Clonal programmes are graph communities of clones; each split is tested against a single Gaussian group, and each programme's stability is estimated by resampling the cells of every clone.
- Clone-level tests quantify how much of the variance between clone profiles a label explains, with labels permuted among the clones of each donor.
The full description, with references, is in Methods.
| Methods | the statistical model behind each step |
| Function reference | every public function and its arguments, generated from the code |
| Compatibility | Python and dependency versions, operating systems and datasets tested |
| Changelog | what changed in each version |
| The manuscript | publication status, datasets, every analysis, open work |
| Case studies | scripts and results for the public datasets |
| Figures | figures of the manuscript, with their source code |
| Benchmark | Threadfin against Clonotrace, clone2vec, Benisse, CoNGA and scirpy |
| Technical validation | the tutorials on 16 public datasets, sensitivity to clone calling and embedding, power, a million cells, T cells |
| Figure gallery | every figure Threadfin draws, for each of the 16 public datasets of the technical validation |
A manuscript describing Threadfin is in preparation. Until it is available, please cite this repository (CITATION.cff) and the tools Threadfin builds on: Dandelion (Suo et al., Nat. Biotechnol. 2024) for clone definition, Scanpy (Wolf et al., Genome Biol. 2018) and UMAP (McInnes et al., J. Open Source Softw. 2018).
Clonotrace, clone2vec, Benisse and CoNGA also combine lineage and transcriptome, and answer related but different questions. On the same data and clones (benchmark, with a one-page overview): Threadfin and Benisse represent every clone with two or more cells by default (clone2vec starts at three cells, Clonotrace at ten), and Threadfin's test of clonal coherence, with clone labels shuffled within samples, keeps its error rate when samples differ, where per-clone graph scores and cell-level tests do not. For recovering measured clone annotations Threadfin is comparable to clone2vec and to a simple mean of the cells' coordinates, and better than Clonotrace at its default and than Benisse; in simulation, clone2vec groups clones by their planted programme and tells mixed from in-between clones more accurately. Threadfin needs a fraction of the others' time (its clone profiles take seconds; clone2vec about 30 times longer, Clonotrace 290 to 2,400 times) and finished every run without help. The complete analysis of 205,630 cells takes 11 minutes on 8 cores, and with a precomputed embedding and given clone ids a million simulated cells take about an hour (run time and memory). The benchmark reports every result, including those where Threadfin is not the best.
- Dandelion — single-cell immune receptor analysis; Threadfin's clone definition.
- Clonotrace — distances between expanded clones on the cell-state graph after label spreading.
- clone2vec — clone embeddings learned from which clones' cells are neighbours.
- Benisse — a joint space of BCR sequences and expression.
- CoNGA — graph-vs-graph analysis of T-cell receptor and expression similarity.
- Scirpy — single-cell immune receptor analysis in the scverse ecosystem; Threadfin reads its AnnData and MuData objects.
- Scanpy and AnnData — the data structures and single-cell tools Threadfin works with.
- Immcantation — B-cell receptor repertoire analysis, including clonal lineage reconstruction.
Please report bugs and ask questions through GitHub issues.
MIT; see LICENSE.